Fig. 5.
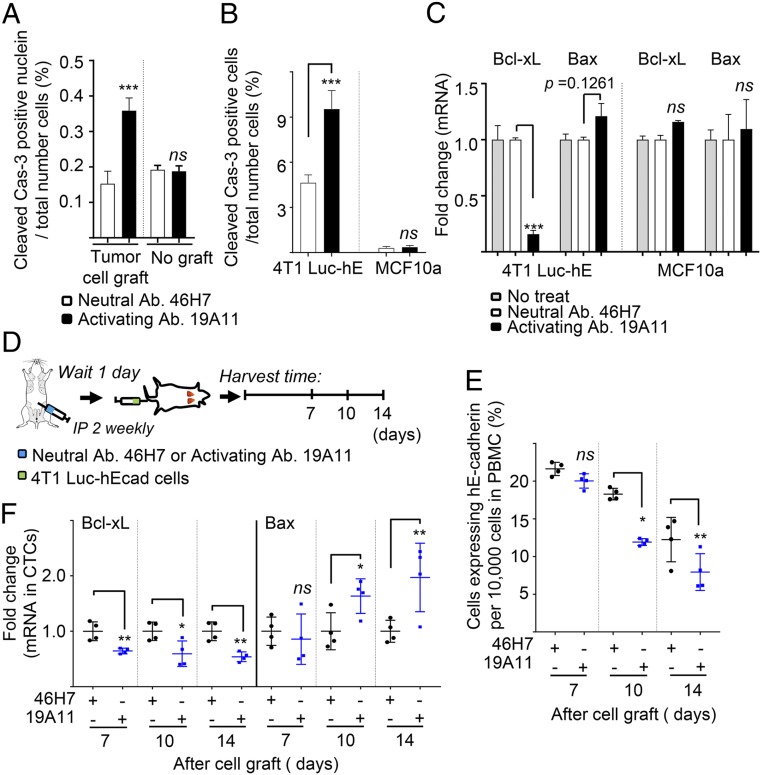
E-cadherin activation increases cancer cell-specific apoptosis. Sections of lung from neutral or activating mAb-treated mice described in Fig. 2B were examined for cleaved caspase-3 by immunofluorescence (A). Cells were measured in at least 10,000 cells, and each percentage represents the average of three randomly chosen fields of 1 sample (×10; n = 4 per group; no graft, n = 3). (B and C) 4T1 Luc-hE and MCF10a cells in culture were treated with 46H7 neutral or 19A11 activating mAb for 24 h. (B) Immunofluorescence staining for cleaved caspase-3 was tested in the 4T1 Luc-hE and MCF10a cells. Each percentage represents the average of three randomly chosen fields of 1 sample (×10; n = 3 per group). (C) Total RNA was prepared and analyzed for expression of the indicated transcripts by qRT-PCR, using specific primers. ***P < 0.001 compared with neutral Ab treatment. (D–F) Schema (D). Mouse was treated with i.p. injections of either 46H7 neutral or 19A11 activating mAb twice weekly until the end of the experiments. One day after beginning the treatment, 4T1 Luc-hE cells were i.v. injected into the tail vein and whole-blood was collected at the indicated times. CTCs expressing hE-cadherin were sorted by FACS. (E) Percentage of CTCs expressing hE-cadherin in blood. Population of cells expressing hE-cadherin per 10,000 cells was measured in peripheral blood mononuclear cells (PBMC) of each mouse by flow cytometry (n = 4). (F) mRNA expression of Bcl-xL (Left) and Bax (Right) in CTCs isolated by hE-cadherin. The levels were normalized by mRNA expression of hE-cadherin, and the fold change was assessed with the control group treated with neutral mAb 46H7 at each point. *P < 0.05; **P < 0.01; ***P < 0.001 compared with neutral Ab treatment. ns, not significant.

