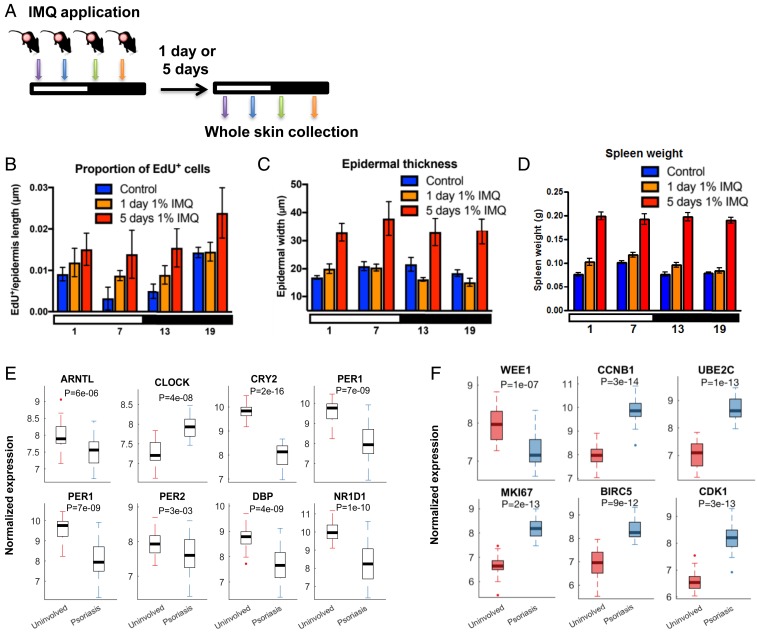
Fig. 1.
IMQ effects on inflammation and core clock gene expression. (A) IMQ treatment protocol. Mice were treated topically with 1% IMQ (colored arrows) at 6-h intervals throughout the day/night cycle (indicated by white and black bars) for either 1 d, or each day for 5 d, and collected 1 d after the last treatment. (B) Epidermal cell proliferation (EdU+ cells). Two-way ANOVA test shows significance between treatments (P = 0.02) and time points (P = 0.005). Tukey’s post hoc test for control vs. 5 d 1% IMQ, P = 0.01. One-way ANOVA for control across ZT times was P < 0.003. (C) Epidermal thickness. Two-way ANOVA shows significance between treatments (P < 0.0001), for both control vs. 5 d IMQ, and 1 d IMQ vs. 5 d IMQ (Tukey’s post hoc test P < 0.0001 for both). Epidermal thickness after 1 d IMQ differed across ZT time (one-way ANOVA P = 0.01). (D) Spleen weights. Spleen weight differed across ZT time and treatments (two-way ANOVA P = 0.03 and P < 0.0001). Spleens weighed more after 1 d of 1% IMQ and 5 d of 1% IMQ compared to controls (Tukey’s post hoc test, P = 0.004 and P < 0.0001). Spleen weight changed across ZT time in controls, and after 1 d of 1% IMQ (one-way ANOVA P = 0.0002 and P = 0.003, respectively). (B–D) Control (blue, n = 5), 1 d of 1% IMQ (orange, n = 7), and 5 d of 1% IMQ (red, n = 5 to 7). Data are presented as mean ± SEM. Comparison of gene expression of core clock genes (E) and cell cycle genes (F) between uninvolved and psoriatic biopsies using RNA-seq data from human skin biopsies. Uninvolved and psoriatic biopsies were collected from the same patient (n = 27) during the time between 9 AM and 4 PM (E and F). (Data in E and F from ref. 47.) Statistical significance was determined by Student’s paired t test and significant P values are shown.

