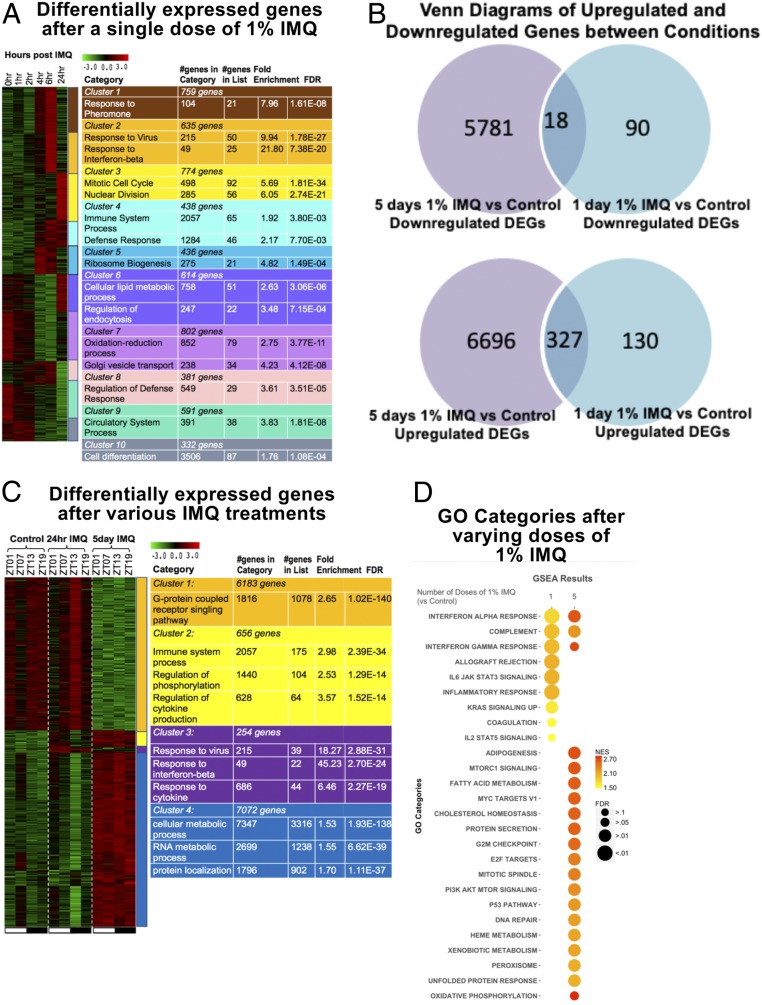
Fig. 2.
Summary of differentially expressed genes (DEGs) and ISGs following single and multiple treatments of 1% IMQ. (A) Heatmap of expression of differentially expressed genes across time, normalized across genes. (B) Venn diagrams of up-regulated and down-regulated genes between 5 d 1% IMQ vs. control and 1 d 1% IMQ vs. control. Scale of circle to other circles within the same diagram do not correspond with number of genes in category. DEGs were identified using Tukey’s post hoc test with a P < 0.05. (C) Heatmap of expression of DEGs between control, 1 d 1% IMQ, and 5 d 1% IMQ timepoints normalized across genes. (A and C) K-means clustering was performed, and clusters were color coded. Color-coded tables on Right list relevant gene ontologies for cluster associated with color. Tables also list the number of genes in each cluster and the number of genes in GO category, number of genes in GO category in the cluster, fold enrichment of GO category in the cluster, and false discovery rate (FDR) value. DEGs were identified using one-way ANOVA and Tukey’s post hoc test. For the heatmap, green, low expression and red, high expression. (D) Two-dimensional (2D) heatmap of GO categories determined using GSEA for 1 or 5 doses of 1% IMQ. Size of circle corresponds to significance of GO category for the treatment and condition. Color of the circle corresponds to enrichment of category.

