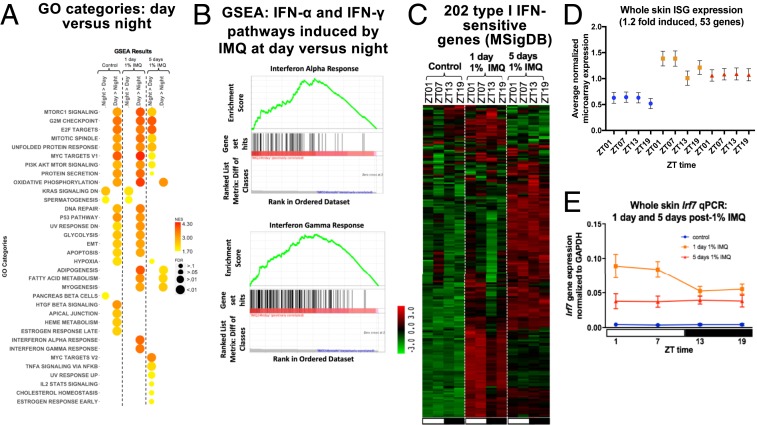
Fig. 3.
Analysis of genes and ISGs following day or night 1% IMQ treatment. (A) Two-dimensional (2D) heatmap of GO categories determined using GSEA in two different treatment groups (night vs. day and day vs. night) across three conditions (control, 1 d 1% IMQ, and 5 d 1% IMQ). Size of circle corresponds to significance of GO category for the treatment and condition. Color of the circle corresponds to enrichment of category. (B) Enrichment plot for IFN-α and IFN-γ hallmark pathways shows a significant enrichment of these pathways after 1 d of 1% IMQ during the day vs. night. (C) Heatmap of 202 ISGs (from MSigDB) from the samples collected in Fig. 2C. Green, low expression and red, high expression. (D) Average normalized whole skin microarray expression (25) of ISGs induced by 1.2-fold or more after IMQ, under homeostasis (blue), 1 d 1% IMQ (orange), and 5 d 1% IMQ (red). One-way ANOVA, control P = 0.001, 1 d 1% IMQ P < 0.0001, 5 d 1% IMQ P = 0.56. (E) qPCR for Irf7 on individual samples collected in Fig. 1A. Student’s unpaired t test comparing daytime vs. nighttime under control [not significant (N.S.)], 1 d (P = 0.02), and 5 d (N.S.). Data represents mean ± SEM of n = 5 to 7.

