Fig. 4.
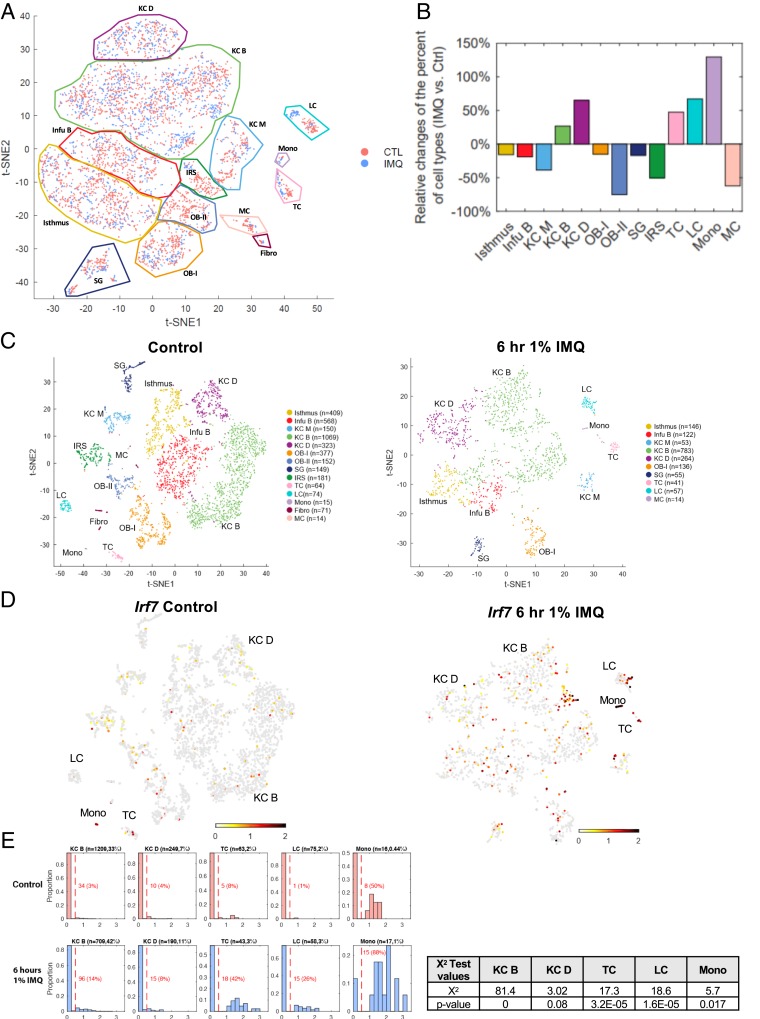
IMQ up-regulates ISG expression in keratinocytes, Langerhans cells, T cells, and monocytes within the epidermis. scRNA-seq was performed on epidermal cells isolated from control and 6 h of 1% IMQ-treated mice (26). (A) Cell from both control (pink) and 6 h 1% IMQ (blue) samples were jointly projected on the same t-SNE plot to better compare different cell subtypes. (B) Histogram representing the relative changes of each cell type in control and IMQ samples. Positive value bars represent percent of cells that were more present in IMQ-treated samples over control and negative value bars the opposite. (C) t-SNE plots of cells isolated from adult male mice, untreated (Left) or treated with 1% IMQ for 6 h (Right). Differentiated keratinocytes (KC D), basal keratinocytes (KC B), basal infundibulum (Infu B), mitotic keratinocytes (KC M), Langerhans cells (LCs), sebaceous gland (SG), melanocytes (MCs), fibroblasts (fibro), monocytes (mono), T cells (TC), Isthmus cells, outer bulge cells group 1 (OB-I), outer bulge cells group 2 (OB-II), and inner root sheath cells (IRS). N refers to the number of cells per population. (D) Irf7 mRNA expression in single-cell data (26). Gray, no expression; red, intensity of expression. (E) Proportion of differentiated KCs (KC D; Krt1+), basal KCs (KC B; Col17a1+), T cells (TC; Cd3g+), LCs (Cd207+), and monocytes (mono; Cybb+) expressing Irf7 in control and IMQ-treated samples. Normalized Irf7 expression is on the x axis and the proportion of cells expressing Irf7 mRNA out of each population is on the y axis. Number of cells analyzed and percent of each population out of total cells analyzed is listed above each graph. Number and percent of cells expressing Irf7 out of each population is listed in red. χ2 test results (Right) of the portion of positive Irf7 between control and treated samples of selected subpopulations and the corresponding P values.

