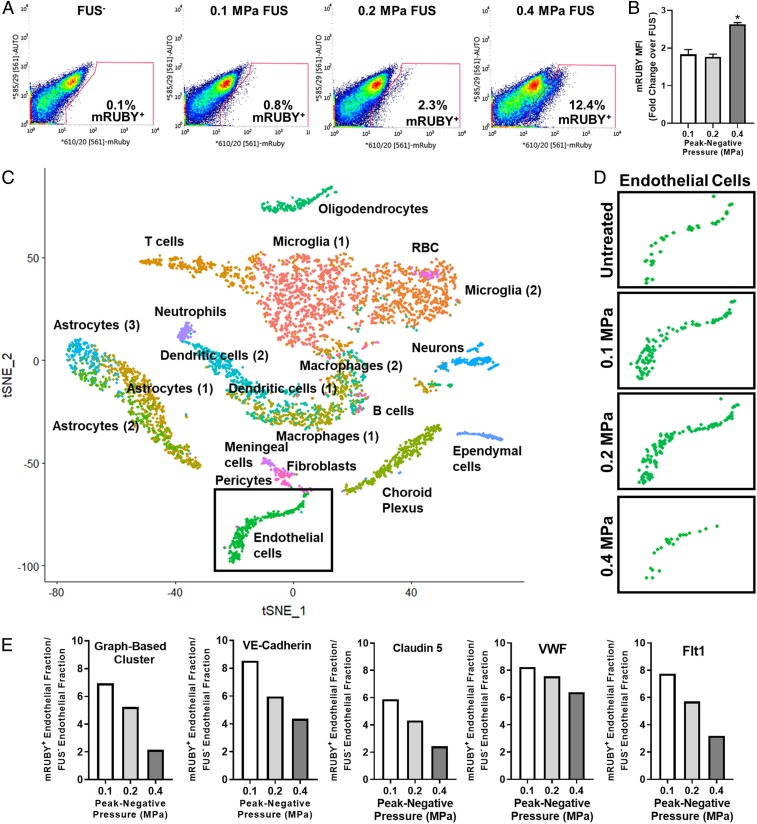
Fig. 4.
Cell identification and enrichment using flow cytometry and single-cell RNA sequencing. (A) Flow cytometry gating used to sort mRUBY+ transfected cells from whole-brain tissue samples. The mRUBY+ fraction increased with PNP. (B) mRUBY MFI for each PNP. *P < 0.0001 vs. 0.1 and 0.2 MPa. One-way ANOVA followed by Dunnett’s multiple comparison tests. (C) tSNE dimensionality reduction of aggregate sample containing cells from untreated and 0.1-MPa FUS, 0.2-MPa FUS, and 0.4-MPa FUS treatment groups. Labels on graph identify corresponding cell clusters. Endothelial cells (green) are boxed. (D) Endothelial cell clusters from tSNE analyses of sham (all cells, not sorted) and FUS-transfected (mRuby+ only) samples. Endothelial cell cluster size comparisons between FUS-treated groups reflect the relative proportion of transfected cells identified as “endothelial” at each PNP. (E) Bar graphs showing that low PNPs markedly enrich the endothelial fraction of transfected cells. The method used to identify endothelial cells (i.e., graph-based clustering or expression of individual markers of brain endothelium, such as VE-Cadherin, Claudin 5, Von Willebrand Factor [VWF], or Vascular Endothelial Growth Factor Receptor-1 [Flt1]) did not significantly affect the relationships between PNP and endothelial enrichment.

