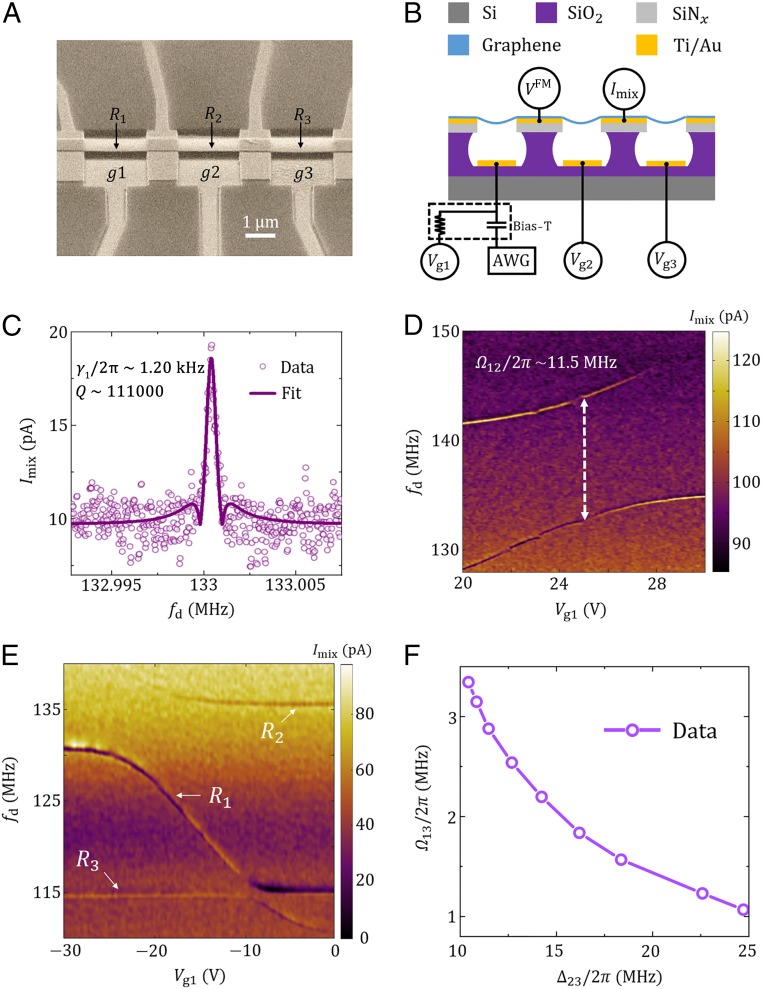
Fig. 1.
Sample structure and mode spectra of the resonators. (A) Scanning electron microscope image of a typical sample with a tilted view angle. Four contacts divide a suspended graphene ribbon into three mechanical resonators, , , and , in a linear chain. (B) Schematic sample structure and measurement setup. A frequency-modulated microwave signal is applied through one contact of the center resonator, and a lock-in amplifier detects the mixing current at the modulation frequency of the inputted FM signal at another contact. The frequencies of the resonators are tuned by dc voltages on the gates, respectively. An arbitrary waveform generator (AWG) is connected to gate g1 to provide additional burst signals for the coherent oscillations. (C) The mixing current as a function of the driving frequency at = 22 V. The measured linewidth of resonator is ∼ 1.20 kHz. Similarly, the linewidth of is ∼ 1.16 kHz and the linewidth of is ∼ 0.73 kHz (SI Appendix, Fig. S2) at a driving power of ∼− 60 dBm. (D) The mixing-current spectrum of resonators and . Coupling strength as large as 11.5 MHz is observed. Here = 17 V and = 0 V. (E) Spectrum of all three resonators. Here is far off-resonance from with a detuning ∼ 20 MHz, with = 14 V, and = 15 V. The dc voltage is scanned over a wide range, to tune the resonant frequency of to cross the frequencies and . A large avoided level crossing is observed when approaches . A smaller energy splitting is observed when approaches due to the indirect coupling. (F) The measured indirect coupling strength between and as a function of . D and E are obtained at a driving power of ∼− 40 dBm to have a better resolution.

