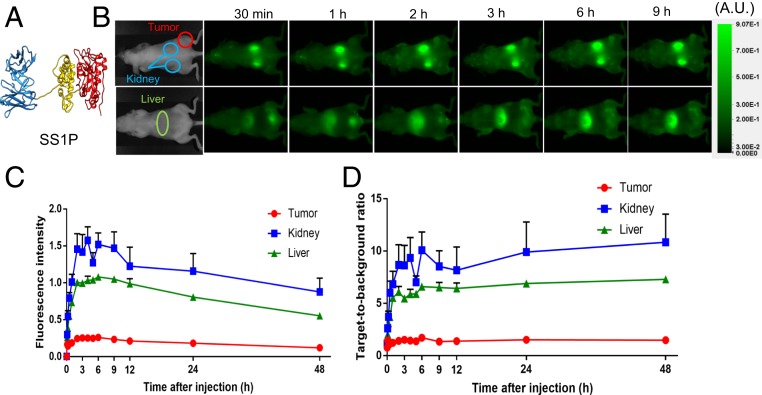
Fig. 1.
(A) Ribbon diagram of immunotoxin SS1P. Fv is in blue, domain II is in yellow, and domain III of PE is in red. The structural model was generated by using UCSF Chimera. (B) Uptake of SS1P by kidney, liver, and tumor in BALB/c mice. C and D are quantification of uptake by kidney, liver, and A431/H9 tumor. The target-to-background ratio indicates the fluorescence subtracted from the background.

