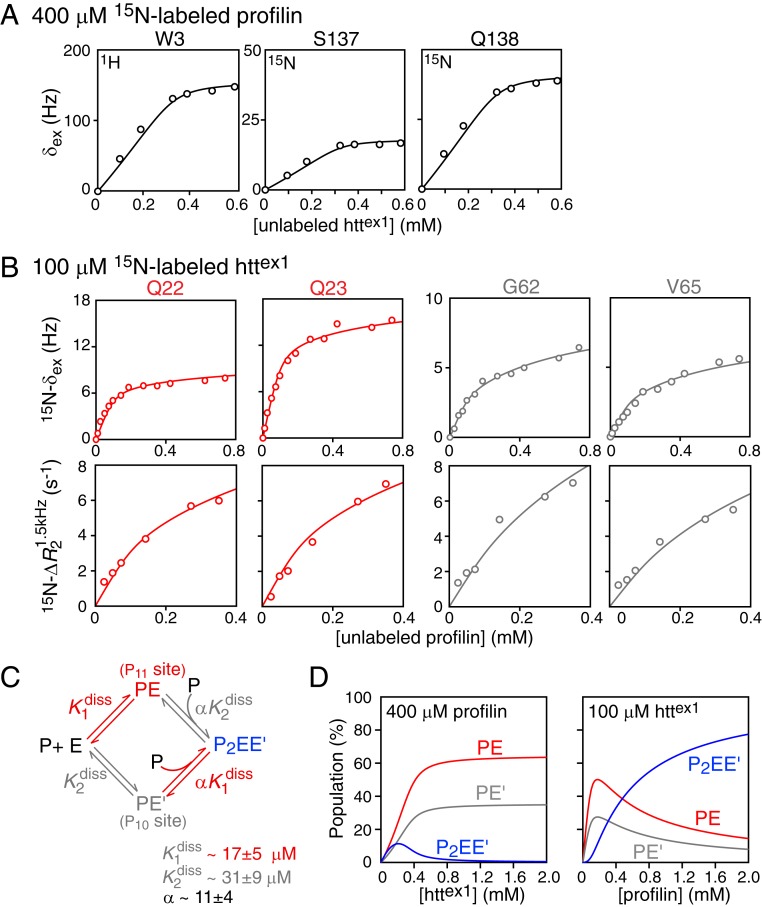
Fig. 4.
Quantitative characterization of the binding equilibria involved in the interaction of profilin with httex1. (A) Exchange-induced shifts for selected residues of 0.4 mM 15N-labeled profilin upon titration with unlabeled httex1. (B) Exchange-induced shifts, δex (Top row) and lifetime line broadening (Bottom row) for Gln22 and Gln23 (red; monitoring binding to P11) and for Gly62 and Val65 (gray; monitoring binding to P10) of 0.1 mM 15N-labeled httex1 upon titration with unlabeled profilin. All experimental data were recorded at 600 MHz and 5 °C. (C) Scheme for the binding of profilin to the two polyproline tracts, P11 and P10, of httex1. The experimental data in A and B are shown by circles, and the best-fit curves from the global fit to the binding scheme shown in C are represented by solid lines. (D) Simulation of species’ populations during the course of the titrations using the best-fit parameters for the equilibrium dissociation constants and cooperativity factor. For errors of 0.3 Hz and 0.6 s−1 for the δex and R2 data, the value of the reduced χ2 is 0.81.

