Fig. 1.
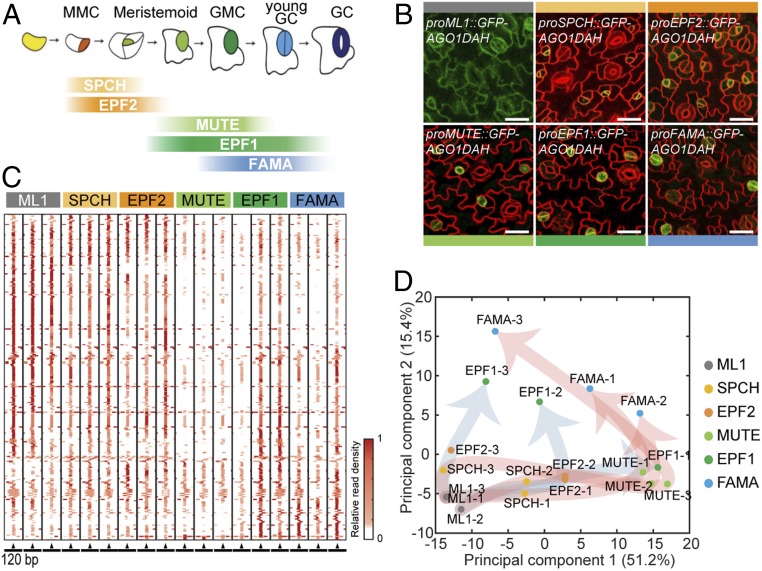
Profiling of stomatal lineage miRNAs. (A) A diagram showing an expression window of each developmental stage-specific marker in the stomatal lineage. (B) Confocal images of transgenic plants expressing GFP-AGO1DAH under the control of the promoters of the marker genes. AGO1DAH from epidermal and GCs was immunoprecipitated to isolate stomatal lineage miRNAs associated with AGO1. Promoters used: ML1 (epidermal cells), SPCH (MMC, Meristemoid), EPF2 (Meristemoid), MUTE (Meristemoid, GMC), EPF1 (GMC, young GC), and FAMA (GMC, young GC). Cell outlines are visualized using FM4-64. (Scale bars, 20 μm.) (C) The heatmap of MIR gene sequences shows the position of AGO1-associated 21-nt small RNAs isolated from stomatal lineage cells, at each developmental stage, harboring AGO1DAH driven by the promoter of the marker genes. MIR genomic sequences are presented in the 120-bp window with mature miRNA sequences placed in the center (arrowhead). The abundance of aligned reads was normalized to the total mapped reads in the individual samples and further normalized to the maximum abundance among 120-bp window across the six stages. (D) Principal-component analysis (PCA) of 266 AGO1-associated miRNAs in stomatal lineage cells indicates divergence in the miRNA populations of the SPCH–MUTE–FAMA (red arrows) and EPF2–EPF1 (blue arrows) paths.

