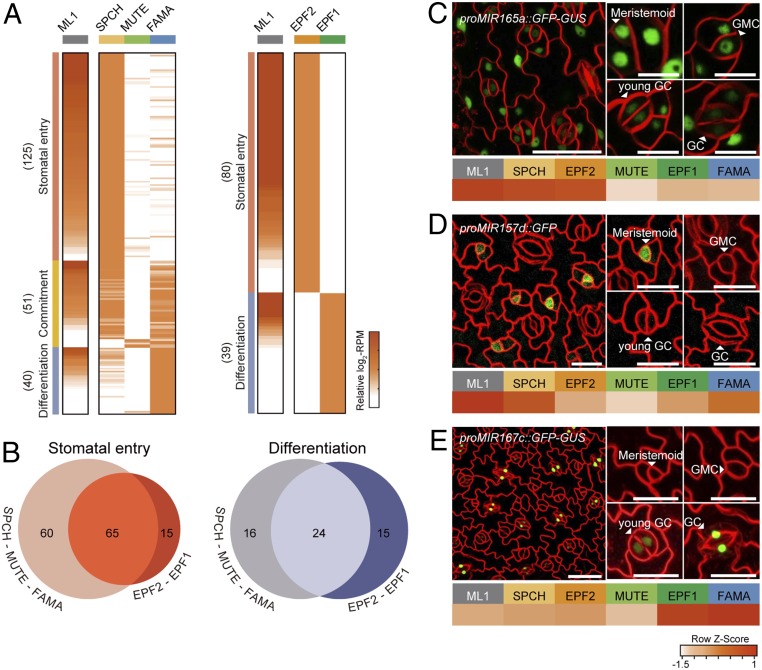
Fig. 2.
miRNA expression profiles in the SPCH–MUTE–FAMA and EPF2–EPF1 paths during stomatal development. (A) The heatmaps show clusters of DE miRNAs expressed in the stomatal lineage cells. DE miRNAs of the SPCH–MUTE–FAMA (Left) and EPF2–EPF2 (Right) paths were grouped into three developmental stages (stomatal entry, differentiation, and commitment) and two developmental stages (stomatal entry and differentiation), respectively. The color bars of the heatmaps represent the gradient scale of relative log2-RPM values for each DE miRNA, which was normalized to the minimum and maximum log2-RPMs across SPCH, MUTE, and FAMA stages (A, Left) as well as EPF2 and EPF1 stages (A, Right). The numbers in parentheses indicate number of miRNAs at each stage. (B) Venn diagrams show overlapping and distinct DE miRNAs between the SPCH–MUTE–FAMA and EPF2–EPF1 paths at the stomatal entry or differentiation stage. (C–E) The heatmaps show the expression levels of miR165a-3p (C), miR157d (D), and miR167c-3p (E) in each of the stomatal lineage cells. Representative confocal images of the epidermis of at least three independent proMIR165a::GFP-GUS (C), proMIR157d::GFP (D), and proMIR167c::GFP-GUS (E) transgenic plants. The arrows indicate cells at each stage of stomatal lineage progression. GC, guard cell; GMC, guard mother cell. Cell outlines are visualized by FM4-64. (Scale bars, 20 μm.)

