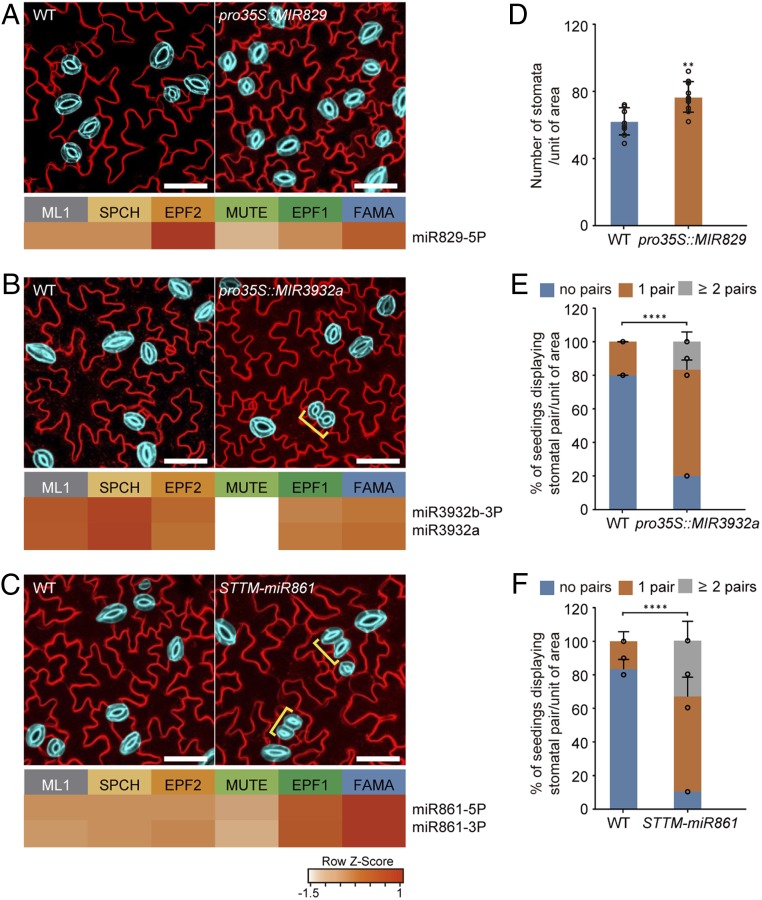
Fig. 3.
Stomatal lineage miRNAs modulate stomatal formation and patterning. (A–C) Stomatal development phenotypes of transgenic plants in which stage-specific miRNAs were overexpressed or down-regulated. The heatmaps show the expression levels of miR829-5p (A), miR3932 (B), and miR861 (C) in the stomatal lineage cells. Representative confocal images of stomata of at least three independent Col-0 (WT), pro35S::MIR829 (A), pro35S::MIR3932a (B), and STTM-miR861 (C) transgenic plants. Mature GCs are highlighted in blue for elucidation, and the brackets indicate stomatal pairs. Cell outlines are visualized by FM4-64. (Scale bar, 50 μm.) (D) Stomatal density in pro35S:MIR829 transgenic plants compared to WT. The number of GCs per unit area (780 × 780 μm2) was scored from at least 10 seedlings for each line. Error bars represent mean ± SD. Two-sided Student’s t test P values; **P < 0.01. (E and F) Numbers of stomatal pairs in pro35S:MIR2932 and STTM-MIR861 plants compared to WT. Percentage of plants having stomatal pairs per area (780 × 780 μm2) in cotyledons of 10-d-old seedlings. Error bars represent mean ± SD calculated from at least 10 seedlings. Two-sided Student’s t test P values; ****P < 0.0001.

