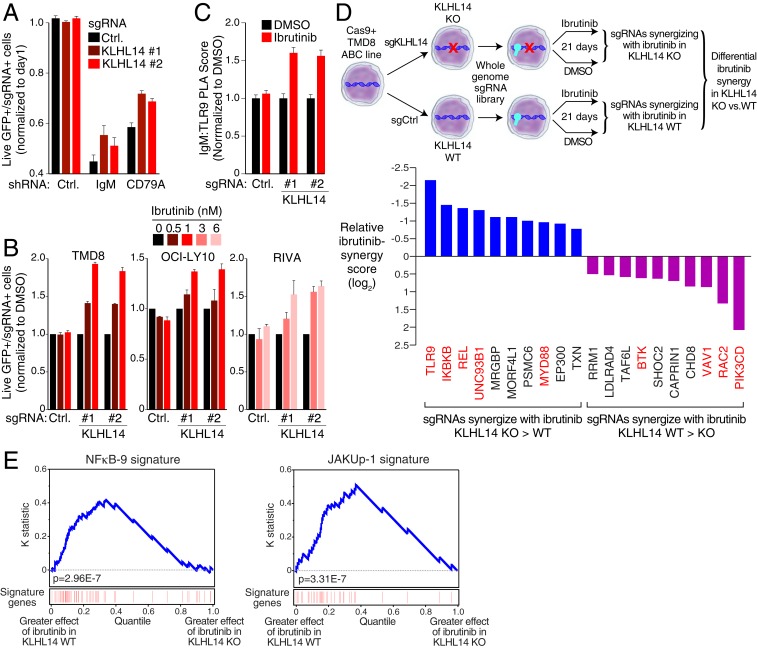
Fig. 5.
KLHL14 alters BCR-dependent NF-κB signaling in ABC DLBCL. (A) FACS analysis of TMD8-Cas9 cells lentivirally transduced with indicated sgRNAs coexpressing a BFP-neomycin fusion protein along with indicated shRNAs coexpressing, GFP (see Materials and Methods for details). (B) FACS analysis of TMD8-, OCI-LY10-, and RIVA-Cas9 cells lentivirally transduced with sgRNA targeting KLHL14 or a nontargeting control, coexpressing a GFP-puromycin fusion protein. Cells were mixed at an ∼1:6 ratio with GFP, negative cells infected with a nontargeting control gRNA, and cultured for 9 d in DMSO, or indicated concentration of ibrutinib. (C) Normalized PLA score for IgM-TLR9 in TMD8- Cas9 cells lentivirally transduced with indicated sgRNAs treated with DMSO or ibrutinib, (5 nM) for 16 h. (D, Top) Schematic representation of CRISPR screen for ibrutinib synergy, in KLHL14 WT and KLHL14 KO TMD8 cells. (D, Bottom) Relative ibrutinib synergy score. My-T-BCR, NF-κB, and proximal BCR signaling regulators are colored red. (E) Kolmogorov–Smirnov test of gene expression signature enrichment in KLHL14 WT and KO cells. Genes were ranked based on the difference in digital gene expression (DGE) between the effect of 24-h ibrutinib (2 nM) treatment (DGEIbrutinib − DGEDMSO) in KLHL14 WT and KO cells, as indicated. The position of genes in the NF-κB-9 and JAKUp-1 signatures in the ranked gene list is shown in red. In A and B, error bars represent SD of triplicates. In C, error bars represent SEM. Data are representative of three independent experiments except in D and E.

