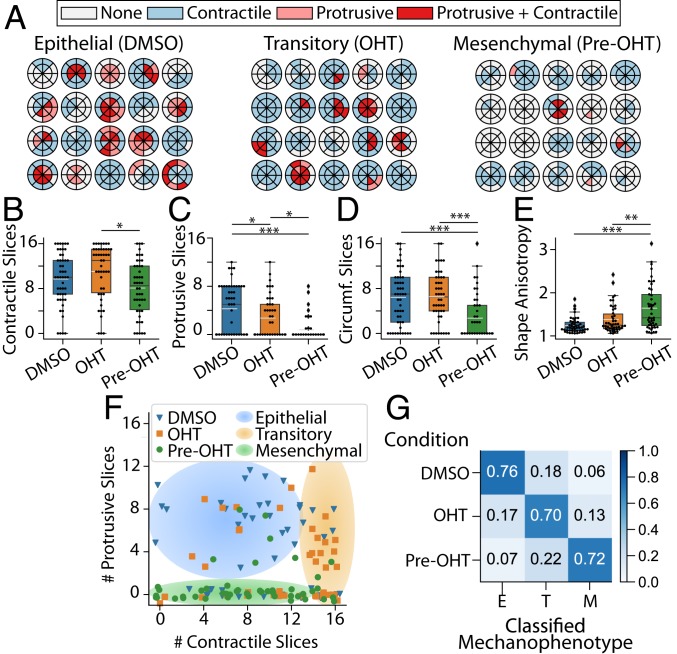
Fig. 3.
(A) Radial DARTS for 20 randomly selected clusters treated with DMSO, OHT, or pretreated with OHT (pre-OHT). (B) Boxplot of the number of contractile displacement slices. (C) Boxplot of the number of protrusive displacement slices. (D) Boxplot of the number of circumferential (Circumf.) displacement slices. (E) Boxplot for cell-morphology shape anisotropy. The white dashed line in the boxplots represents the mean value. *P 0.05; **P 0.01; ***P 0.001. (F) Scatter plot of raw data points for number of protrusive and contractile displacement slices ( and ) for DMSO-treated, OHT-treated, or OHT-pretreated clusters. Jitter has been applied to the true positions of the raw data points to avoid points occlusion. The shaded regions are a guide to the eye to emphasize groupings of epithelial, transitory, or mesenchymal mechanophenotypes. (G) Normalized confusion matrix for the decision tree classifier using , , number of circumferential displacement slices (), and shape anisotropy () metrics on the training data. E, epithelial; M, mesenchymal; T, transitory.

