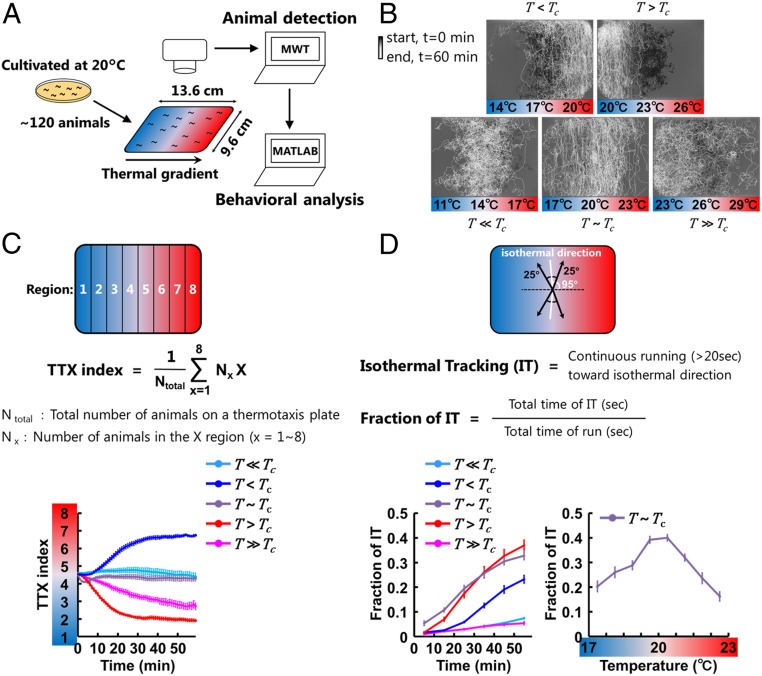
Fig. 1.
Thermotaxis behavior changes in thermal environments (T) relative to the cultivation temperature (Tc). (A) MWT system for the extraction of behavioral components during thermotaxis behavior. The thermotaxis assays were performed as previously reported (5). The positions and postures of animals were captured by the MWT system and then analyzed by custom-built MATLAB scripts. (B) Animals cultivated at 20 °C were placed on a TTX plate with a thermal gradient with 14 °C (Lower Left, T << Tc), 17 °C (Upper Left, T < Tc), 20 °C (Lower Middle, T ∼ Tc), 23 °C (Upper Right, T > Tc), or 26 °C (Lower Right, T >> Tc) at the center. Shown here are the representative trajectories of ∼120 animals that were recorded by MWT. The time from the start of the assays is represented in gray scale. (C) The time course of TTX indices calculated using the described equation and averaged within the assays (n = 7 to 12). Error bars indicate SEM. (D) IT is defined as continuous moving toward isothermal direction ±25° for longer than 20 s (Upper). Isothermal direction was tilted by 5° along the distortion of the thermal gradients near the edges of the plates. Lower Left shows the time course of fractions of IT. Lower Right shows the fraction of IT as a function of the absolute temperature during 30 to 60 min after the start of the assays. In C and D, cyan lines correspond to experiments in the T << Tc condition, blue lines correspond to experiments in the T < Tc condition, purple lines correspond to experiments in the T ∼ Tc condition, red lines correspond to experiments in the T > Tc condition, and magenta lines correspond to experiments in the T >> Tc condition.

