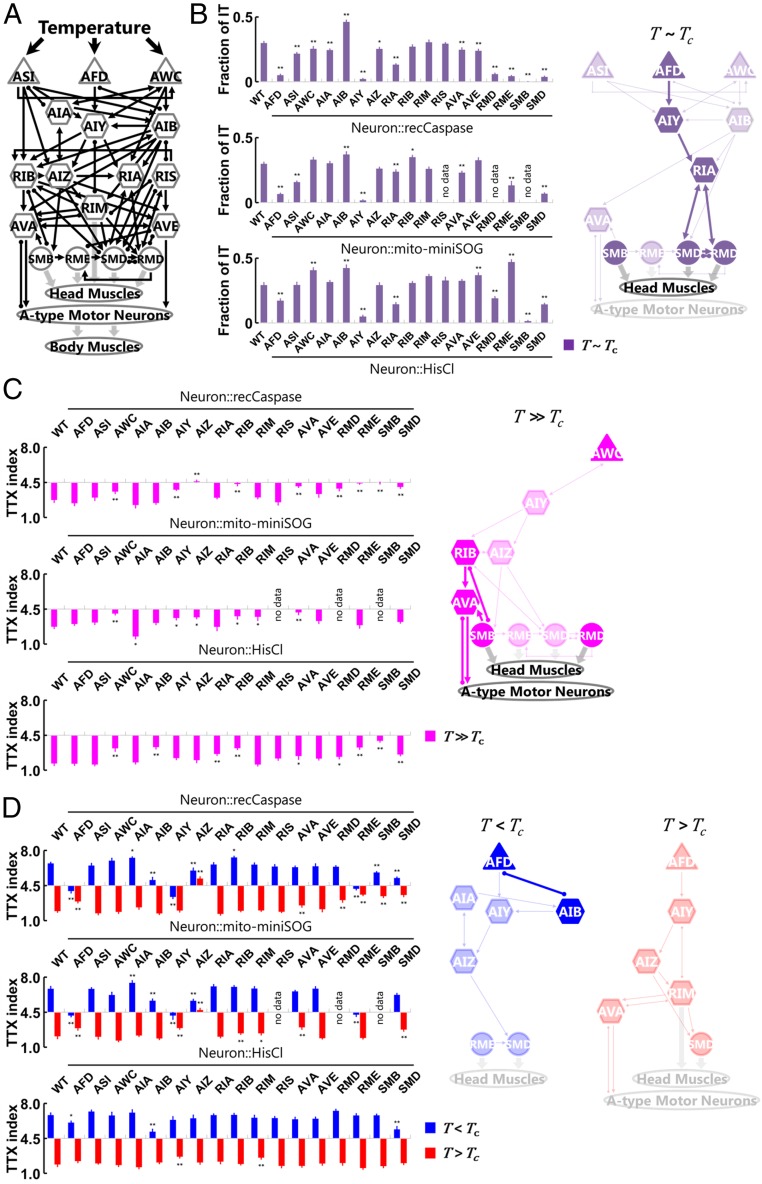
Fig. 2.
Distinct sets of neurons are involved in the isothermal tracking (IT) and in the migration up or down toward the Tc. (A) Candidate neurons for cell-specific ablations, including thermosensory neurons (triangles), interneurons (hexagons), and head motor neurons (circles). Black thin arrows indicate chemical synapses, black undirected lines with round endings indicate gap junctions, and gray thick arrows indicate neuromuscular junctions. (B, Left) Fractions of IT during 30 to 60 min after the start of the assays (n = 4 to 12) of wild-type (WT) animals and the cell-ablated/silenced animals expressing reconstituted caspases (Upper), mito-miniSOG (Middle), or HisCll1 (Lower). B, Right is a neural diagram for mediating IT in the T ∼ Tc condition. The neurons in which their removal showed significant impairment of IT fraction in all of the genetic manipulations are shown in deep color, and the neurons in which their removal showed significant impairment or enhancement in at least two of three manipulations are shown in pale color. (C and D, Left) TTX indices at 60 min after the start of the assays (n = 5 to 12) of WT animals and the cell-ablated/silenced animals expressing reconstituted caspases (Upper), mito-miniSOG (Middle), or HisCl1 (Lower). The indices in the T >> Tc condition are represented as magenta columns (C), the indices in the T < Tc condition as blue columns, and the indices in the T > Tc condition as red columns (D). Right are neural diagrams for mediating the migrations toward the Tc in the T >> Tc condition (magenta), in the T < Tc condition (blue), and in the T > Tc condition (red). The neurons in which their removal showed significant impairment of TTX index in all of the genetic manipulations are shown in deep color, and the neurons in which their removal showed significant impairment or enhancement in at least two of three manipulations are shown in pale color. Error bars indicate SEM. **P < 0.01 and *P < 0.05, different from WT, using Dunnett’s multiple comparisons test.

