Fig. 3.
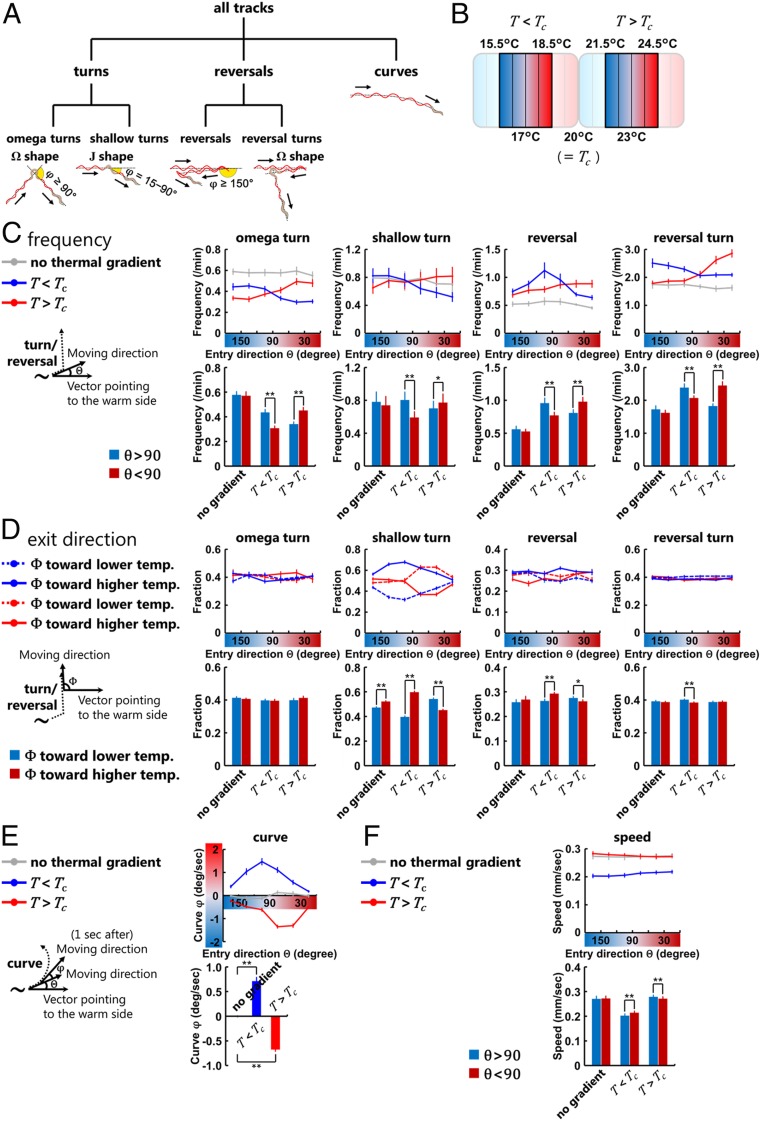
Behavioral components are oppositely biased depending on the context. (A) Classification and definition of C. elegans behavioral components used in this study. Turns, reversals, and curves are classified as previously proposed (33–36). (B) Temperature range within which the behavioral components were analyzed. Animals in the center four fractions of the assay plate were analyzed. (C, Upper Right) Frequency plots of the turns and the reversals representing the average as a function of the entry direction θ (Left). (C, Lower Right) Comparisons of the frequency of each behavioral event. Deep blue columns indicate the frequencies while the animals are moving down the thermal gradient (θ > 90), and deep red columns indicate the frequencies while moving up the thermal gradient (θ < 90). (D) Fraction plots of the exit direction Φ after the turns and the reversals (Left) representing the average as a function of the entry direction θ (Upper Right) and the averages in all of the moving directions of animals (Lower Right). Dashed lines and deep blue columns indicate the fraction of Φ biased toward the lower temperature, and solid lines and deep red columns indicate the fraction of Φ biased toward the higher temperature. (E) Plots of the biases φ of curves (Left) representing the averages as a function of the entry direction θ (Upper Right) and the averages in all of the moving direction of animals (Lower Right). φ is defined as positive if biased toward higher temperature and negative if biased toward lower temperature. (F, Upper) Speed plots representing the averages as a function of the entry direction θ. Deep blue columns (Lower) indicate the speeds while the animals are moving down the thermal gradient (θ > 90), and deep red columns indicate the speeds while moving up the thermal gradient (θ < 90). In C–F, gray lines correspond to experiments without the thermal gradient (20 °C constant), blue lines correspond to experiments in the T < Tc condition, and red lines correspond to experiments in the T > Tc condition (n = 9 to 12). Error bars indicate SEM. (C, D, and F) **P < 0.01 and *P < 0.05 using paired Student’s t test; (E) **P < 0.01 using one-way ANOVA followed by a Tukey–Kramer post hoc multiple comparisons test.

