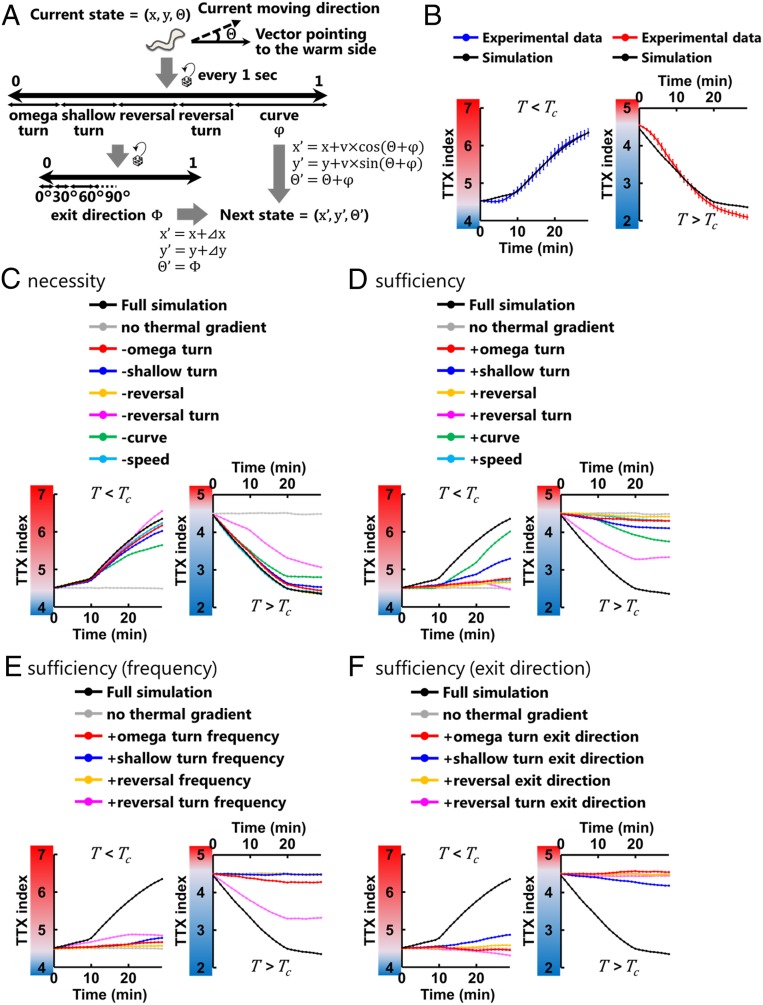
Fig. 4.
Behavioral components are employed differently depending on the context. (A) Schematic structure of the thermotaxis behavior simulation. Animal’s state was defined by its position (x, y) and moving direction relative to the vector pointing to the warm side (θ). We updated the states of the animal every second according to the experimentally observed data: the frequencies and the exit directions (Φ) of the turns and the reversals, the biases of the curves (φ), and the speeds (v), all of which were applied as functions of θ and T versus Tc. The displacements during the individual turns (⊿x, ⊿y) were also employed when updating the states of the animals. (B) The time course of TTX indices in the simulations (black lines) and that obtained from experimental data (colored lines). In the simulations, we iterated assays 100 times, each with 100 animals, and the TTX indices were averaged within the assays. Error bars indicate SEM. (C) The time course of TTX indices in the simulations in which the data of the individual behavioral components determined by the experiment with the thermal gradient were replaced with the data of the corresponding component without the gradient. (D–F) The time course of TTX indices in the simulations in which the data of the individual behavioral components without the thermal gradient were replaced with the data of the corresponding components with the gradient. (D) Data of both frequencies and exit directions were replaced. (E) Data of frequencies alone were replaced. (F) Data of exit directions alone were replaced. In C–F, black lines correspond to the simulation in which all of the data of wild-type animals determined by the experiment with the thermal gradient were used, and gray lines correspond to the simulation in which all of the data of wild-type animals without the gradient were used. The other colored lines correspond to the simulation with the replacements of the individual behavioral components: the omega turn (red lines), the shallow turn (blue lines), the reversal (yellow lines), the reversal turn (magenta lines), the curve (green lines), and the speed (light blue lines).

