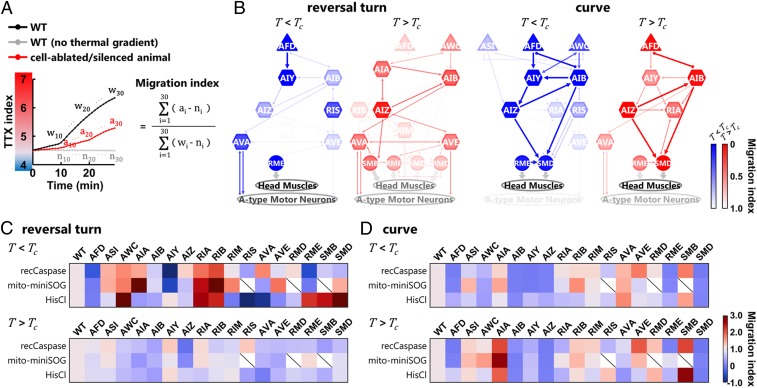
Fig. 5.
Distinct sets of neurons are responsible for the context-dependent biases in the behavioral components. (A) Formula for the migration index. TTX indices from the simulation of cell-ablated animals (ai, red line) were compared with the indices from the simulation of WT animals without the thermal gradient (ni, gray line) in every minute, and the difference between them was summed up within 1 to 30 min. The value was normalized with the summation of the difference between the TTX indices from the simulation of WT with the thermal gradient (wi, black line) and the indices of WT without the gradient. (B) Neural diagrams responsible for generating the biases in the reversal turns and the curves in the T < Tc condition (blue) and in the T > Tc condition (red). The thickness and color strength of each neuron represent the functional importance of the neuron predicted from the analysis and were determined as follows: For each neuron, the differences between the migration index of the wild-type animals and the index of the cell-ablated/silenced animals expressing reconstituted caspases, mito-miniSOG, or HisCl1 were calculated. The median difference from the three ablation strategies (or the smaller difference from the two strategies) is used to determine the color strength, where the color strength of each neuron is proportional to this value. The color strength of each line is identical to the strength of the color of one of the two connected neurons with lower strength, and the thickness of each line is proportional to this color strength. (C and D) Heatmaps showing migration indices of the reversal turns (C) and the curves (D) after cell-specific ablation and silencing in the T < Tc condition (Upper) and in the T > Tc condition (Lower).

