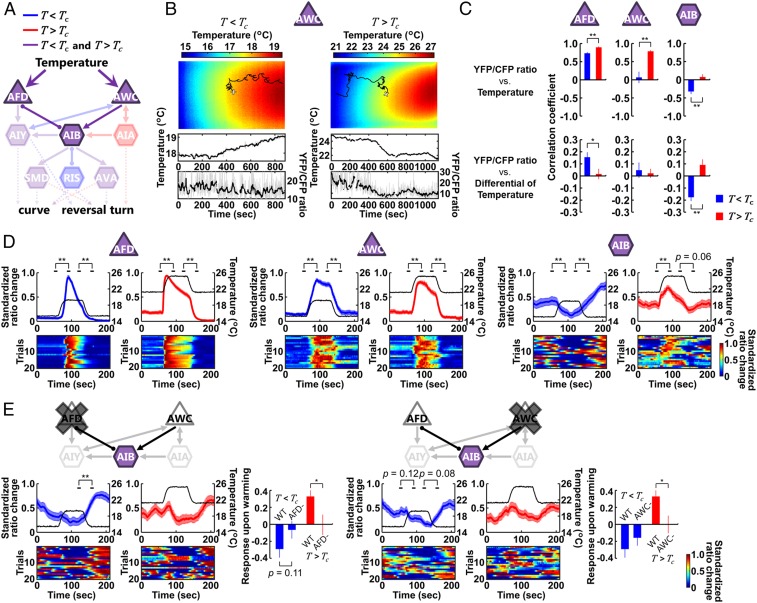
Fig. 6.
Difference of the context is encoded in AFD and AWC thermosensory neurons and evokes opposing responses in AIB. (A) Representative sensory neurons and first-layer interneurons that regulate the curves or the reversal turns in the T < Tc condition (blue), in the T > Tc condition (red), or in both conditions (purple). Thin arrows indicate chemical synapses and an undirected line with round endings indicates gap junction. (B, Upper) Representative trajectory of an animal (black line) projected on a thermography image, providing the time course of the temperature changes (Middle). The white + marks the starting point when recording starts. The YFP/CFP ratio was calculated from YFP and CFP fluorescences of the fluorescence resonance energy transfer (FRET)-based calcium probe yellow cameleon × 1.60 expressed in the individual neurons (Lower). The gray line denotes the ratio, and the black line denotes the median for the time series of the ratio (SI Appendix, Materials and Methods). (C) Calcium imaging of AFD, AWC, and AIB in freely moving animals. Correlation analysis of the standardized ratio change of the individual neurons versus the absolute temperature (Upper) and the differential of temperature (Lower) in the T < Tc condition (blue columns) and in the T > Tc condition (red columns) was performed (n = 14 to 17). (D and E) Calcium imaging of AFD, AWC, and AIB in immobilized animals. (Upper) Standardized ratio changes of the individual neurons (n = 20 to 21). Two types of temperature stimuli (black lines) were used: 15 to 19 to 15 °C and 21 to 25 to 21 °C linear warming and cooling. Average standardized ratio changes for 10 s before and after temperature transitions were compared. The differences between average standardized ratio changes of AIB for 10 s after and before temperature increment were defined as responses upon warming. (Lower) Heatmaps of standardized ratio changes (blue = 0, red = 1.0). Error bars and shaded regions around traces indicate SEM. (C and E) **P < 0.01 and *P < 0.05 using Student’s t test. (D and E) **P < 0.01 and *P < 0.05 using paired Student’s t test.

