Fig. 5.
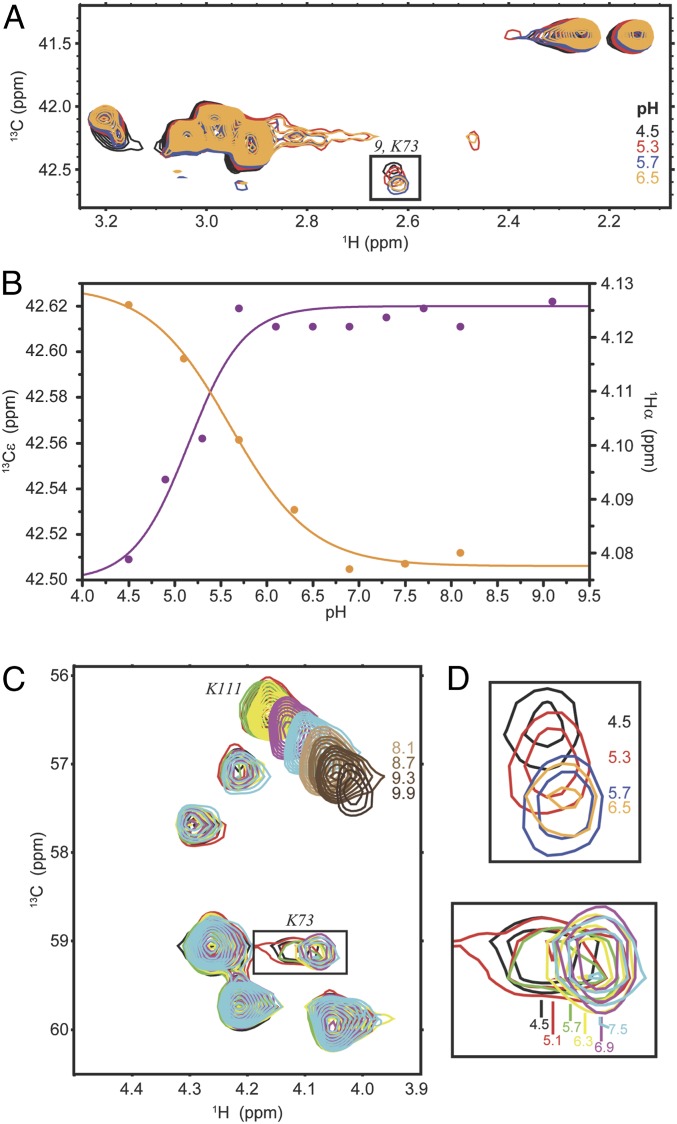
NMR titration data of CTX-M-9 in complex with avibactam. (A) 1H-13C HSQC spectrum of avibactam-bound [13Cε]-Lys–labeled CTX-M-9 at pH 4.5 (black), 5.3 (red), 5.7 (blue), and 6.5 (orange). The boxed signal is expanded in D (Top) and is tentatively assigned to the Cε–Hε group of Lys73. (B) The chemical shift dependence for the Cε of lysine “9” (magenta) and for the tentatively assigned Hα of Lys73 (orange). The curves are nonlinear least square fits to Eq. 1. (C) The Cα–Hα region of avibactam-bound [U-13C]-Lys–labeled CTX-M-9 at pH 4.5 (black), 5.1 (red), 5.7 (green), 6.3 (yellow), 6.9 (magenta), and 7.5 (cyan). The boxed signal, which is tentatively assigned to the Cα–Hα group of Lys73, is expanded in D (Bottom) and is broadened beyond detection at pH 8.7. The signal corresponding to the Cα–Hα group of Lys111 is also shown at higher pH. It shifts throughout the titration (pH 4.5 to 9.9) and it does not follow a monophasic pH dependence, presumably due to the presence of other ionizable groups in its vicinity (SI Appendix, Fig. S2C). (D) Expanded regions shown boxed in A (Top) and C (Bottom).

