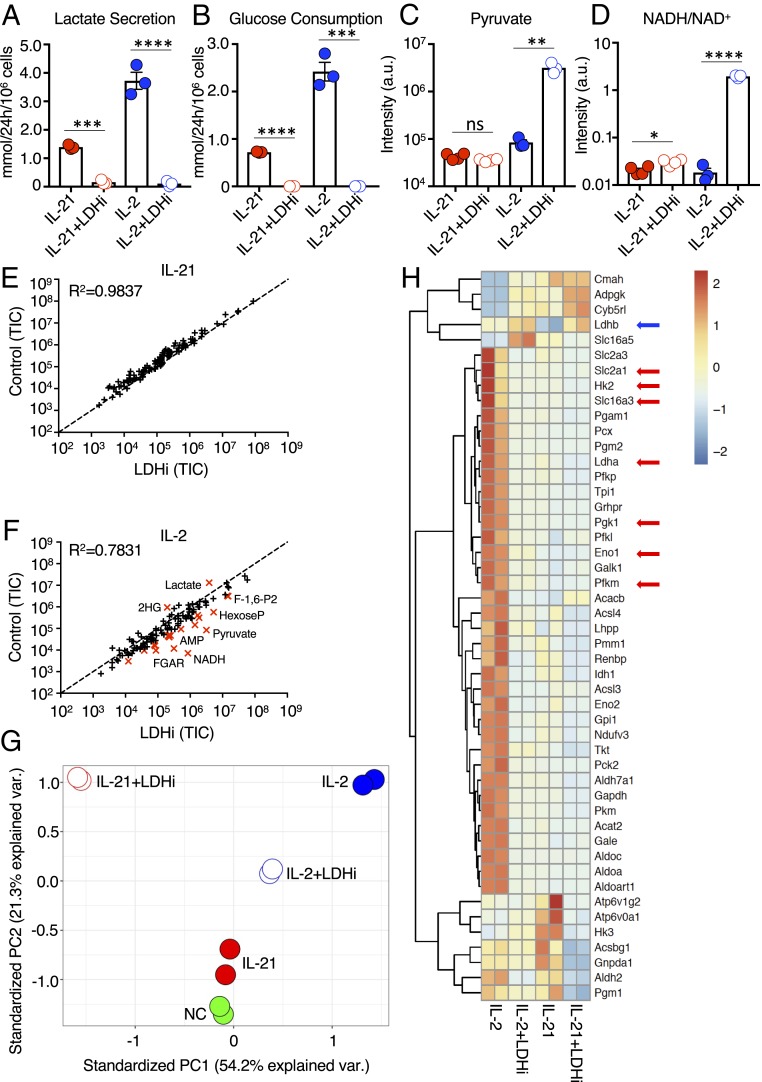
Fig. 2.
LDH inhibition alters glycolytic flux and transcriptional programming. (A and B) Using a YSI 2900 Series Biochemical Analyzer, media measurements for lactate secretion (A), and glucose consumption (B) were determined for cells treated with IL-2 or IL-21 without or with LDHi. (C and D) Pyruvate levels (C) and intracellular NADH/NAD+ ratio (D) were assessed by LC-MS for cells treated with IL-2 or IL-21 in the absence or presence of LDHi. (E and F) Truth plot showing correlation of intracellular metabolites for cells treated with IL-21 versus those treated with IL-21+LDHi (E) or IL-2 versus IL-2+LDHi (F); in F, the metabolites in red had a fold change >4. (G) Principal component analysis generated from RNA-Seq data of cells treated with NC, IL-2, IL-21, IL-2+LDHi, or IL-21+LDHi. (H) RNA-Seq heatmap displaying differentially expressed metabolic genes between cells treated with IL-2, IL-2+LDHi, IL-21, or IL-21+LDHi. Each stimulation was performed in duplicate. *P < 0.05; **P < 0.01; ***P < 0.001; ****P < 0.0001; ns, not significant.

