Fig. 1.
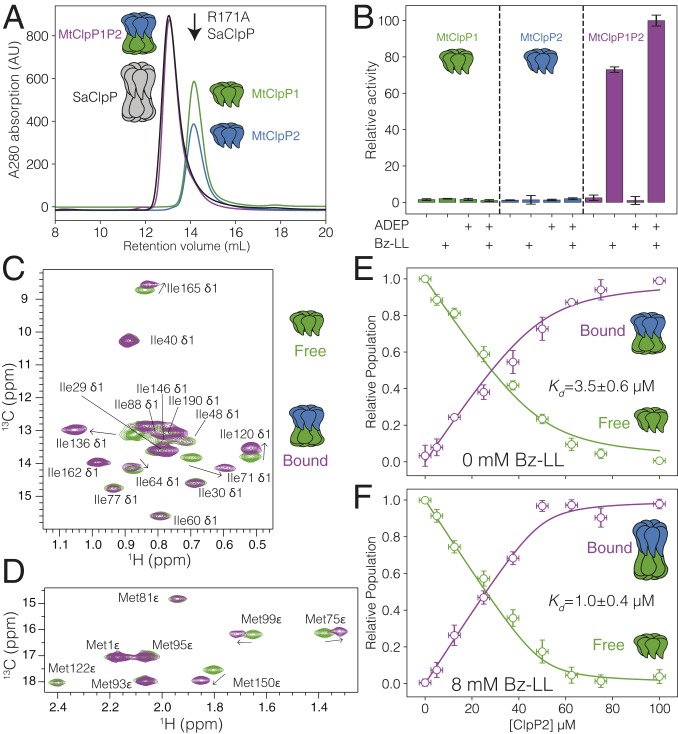
Characterization of the interaction between MtClpP1 and MtClpP2. (A) SEC profiles of isolated MtClpP1 (residues 7 to 200; green trace) and MtClpP2 (residues 16 to 214; blue trace) and a mixture containing equimolar amounts of the two (purple trace). The SEC elution profile of WT tetradecameric SaClpP (black trace) and the elution volume of an R171A, heptameric mutant of SaClpP (black arrow) are included. In all cases, 0.5 mL of protein at a concentration of 175 µM (monomer) was injected. A280 = absorbance at 280 nm. (B) Peptidase activity assays, 40 °C, on isolated MtClpP1 (green bars) and MtClpP2 (blue bars) and mixtures containing equimolar amounts of the two (purple bars) performed in the presence or absence of Bz-LL (4 mM) and/or ADEP (25 µM) activators with 250 µM PKM-AMC used as substrate. In all cases, the concentration of each of MtClpP1 and MtClpP2 was 1 µM (monomer concentration). Error bars correspond to one SD based on three measurements. (C and D) Overlay of the (C) Ile and (D) Met regions of 1H-13C HMQC correlation maps of ILVM-labeled MtClpP1 (green contour) and a mixture containing 50 µM ILVM-labeled MtClpP1 and 100 µM [U-2H] MtClpP2 (purple contours) recorded at 40 °C, 18.8 T, with assignments. (E and F) Changes in the intensity of the apo (green circles) and bound peaks (purple circles) in a titration of [U-2H] MtClpP2 into 50 µM ILVM-labeled MtClpP1 in the (E) absence or (F) presence of 8 mM Bz-LL. Error bars correspond to one SD measured across all peaks averaged (vertical) or uncertainties in protein concentrations based on repeat concentration measurements (horizontal), and the solid lines are fits to a simple binding model (SI Appendix). The fitted dissociation constant plus or minus twice the SD is indicated in each plot.

