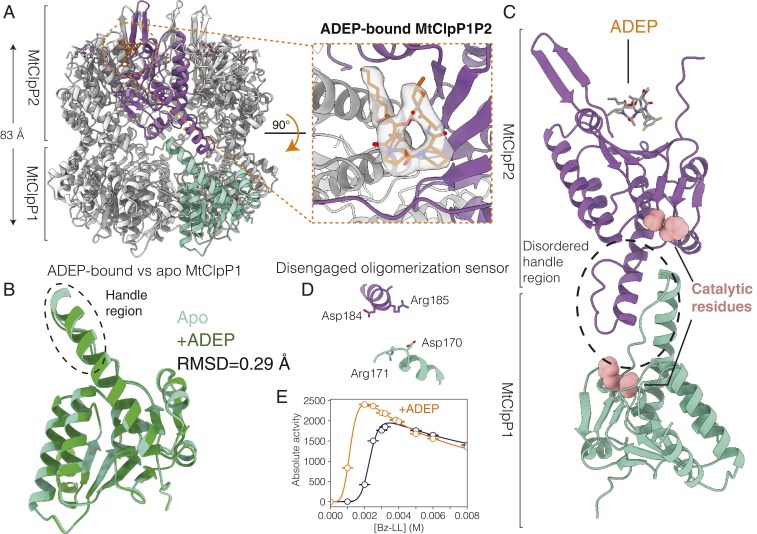
Fig. 3.
Structural basis for the lack of activity of ADEP-bound MtClpP1P2. (A) Side view of a cryo-EM structure of MtClpP1P2 bound to ADEP only. The height of the MtClpP1P2 barrel (excluding the N-terminal β-hairpins of MtClpP2) is denoted. Inset shows the top view of the MtClpP1P2 complex looking down into the ADEP binding pocket at the interface of a pair of adjacent MtClpP2 protomers. The cryo-EM density corresponding to bound ADEP is displayed. (B) The rmsd and overlay of single MtClpP1 protomers from MtClpP1P2 structures in the apo (light green) and the ADEP-bound (dark green) forms. Notably, the handle region (circled) remains disordered in the ADEP-bound form as in the apo structure. (C) Magnified view of a pair of opposite MtClpP1 (cyan) and MtClpP2 (purple) protomers shown to highlight the disordered handle region and its position relative to the catalytic residues and the bound ADEP molecule. (D) Status of the oligomerization sensor in the ADEP-bound MtClpP1P2 complex. The side chains of residues involved in salt bridge formation in the active Bz-LL–bound conformation are indicated. (E) Activity response curves, 40 °C, measured as a function of Bz-LL concentration using 250 µM PKM-AMC as substrate in the absence (blue curve) and presence (orange curve) of 25 µM ADEP.

