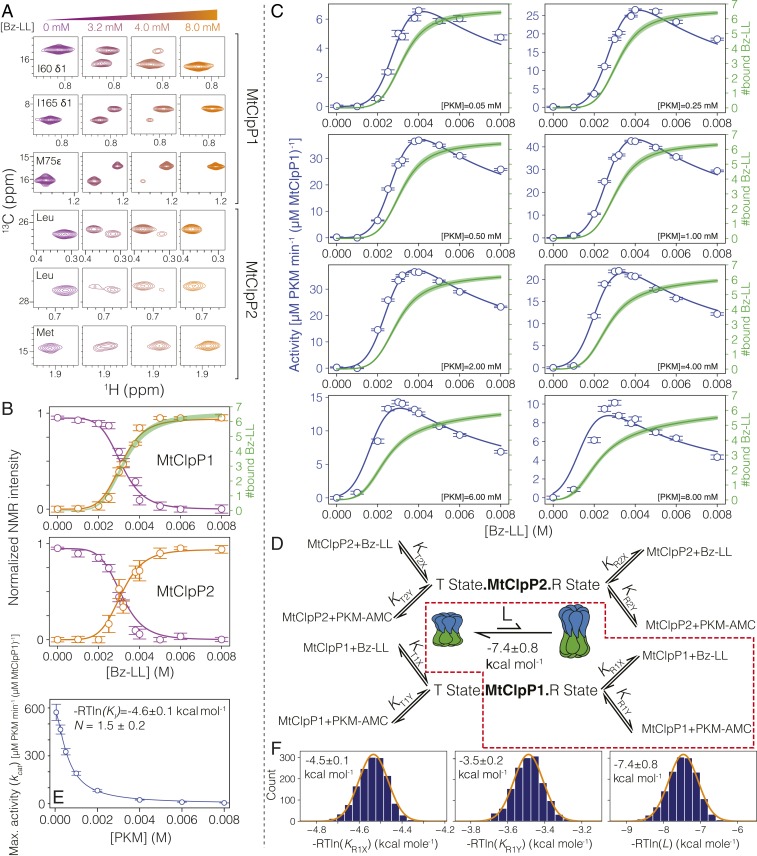
Fig. 4.
An allosteric network regulates the activation of MtClpP1P2. (A) Changes in correlations in 1H-13C HMQC spectra of MtClpP1P2 recorded as a function of Bz-LL concentration, 40 °C, 18.8 T, reflect interconversion between conformers on a slow timescale. The first three rows show spectral regions of datasets recorded on an MtClpP1P2 complex where MtClpP1 is ILVM labeled (50 µM), while MtClpP2 is [U-2H] (100 µM). Assignments for MtClpP1 residues are indicated. The labeling pattern and protein concentrations are reversed in spectra of the bottom three rows. Assignments for MtClpP2 are not available, and therefore, only residue types are noted. (B) Changes in the intensities of T-state (purple circles) and R-state (orange circles) peaks averaged for resonances from MtClpP1 and MtClpP2 of the MtClpP1P2 complex. Error bars correspond to one SD based on all peaks averaged. Solid lines are fits to SI Appendix, Eqs. S11 and S12 using a simplified version of the modified MWC model, whereby only the region highlighted by the dashed red box in D is included in the analysis (i.e., all equilibrium constants are set to zero with the exception of KR1X and KR1Y). Note that profiles in B and C were fit simultaneously. The number of Bz-LL molecules bound to MtClpP1 rings (green line; thickness indicates an error of two SDs from the mean) is calculated by evaluating SI Appendix, Eq. S17 using the fitted KR1X and KR1Y values. (C) Activity of MtClpP1P2 measured at various Bz-LL and PKM-AMC concentrations (blue circles) and best fits of the data to SI Appendix, Eq. S13 (blue lines) (SI Appendix) using a simplified version of the modified MWC model (red box in D). In each panel, curves (solid green; ±2 SD from the mean) showing the number of Bz-LL molecules bound to the R state of MtClpP1 are calculated from SI Appendix, Eq. S17 as above. (D) Schematic representation of the derived MWC model along with the simplified model used for global fitting of the NMR and functional data in this figure (red dashed box) (SI Appendix, Fig. S8 shows the fitting of the complete model), including the T ⇌ R equilibrium, with equilibrium constant . The relevant association constants are indicated in gray. (E) The decrease in kcat [Vo([Y])] (SI Appendix, Eq. S13) as a function of substrate PKM-AMC concentration (open circles) fitted to a Hill-type substrate inhibition model (solid line). The fitted association constant (−RTlnKi) for substrate binding to a distinct inhibitory site and the Hill constant (N) are listed. Errors are based on a Monte Carlo analysis discussed in SI Appendix. (F) The fitted free energies for Bz-LL and PKM-AMC binding to the R state of the MtClpP1 ring are listed, 40 °C, along with the distribution of values based on a Monte Carlo analysis. The distributions in F are fitted to a Gaussian function, and the errors are reported as twice the SD in the parameters.

