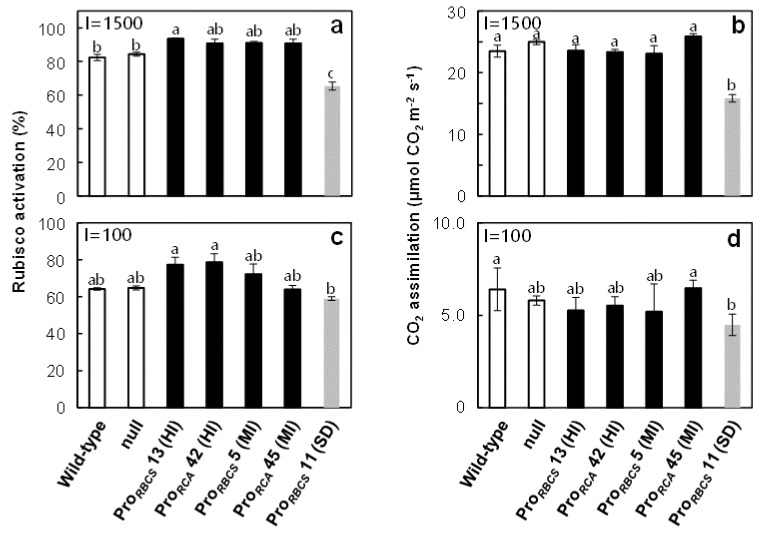
Figure 5.
(a,c) Rubisco activation and (b,d) the rates of CO2 assimilation at an ambient CO2 partial pressure (Ca = 40 Pa) and high and low irradiances (PPFD of 1500 and 100 μmol quanta m–2 s–1). Measurement were done on uppermost, fully expanded leaves in plants grown at 2.0 mM-N. The white, black, and grey bars indicate wild-type and null plants, RCA-overproduced plants, and plants with RCA suppression, respectively. Data are means ± SE (n = 3–5). Statistical analysis was carried out by ANOVA with a post hoc Tukey–Kramer’s HSD test. Different letters indicate significant differences among genotypes (p < 0.05).

