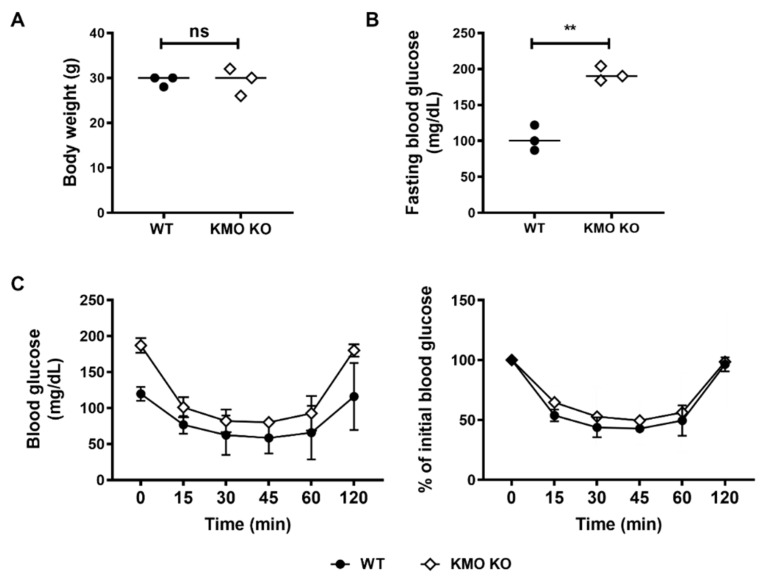
Figure 5.
Fasting blood glucose was higher in KMO KO mice than in WT mice, but body weights and insulin tolerance test results were similar. The body weights were similar in WT and KMO KO mice (A). Fasting blood glucose (FBG) was higher in KMO KO mice (B). The KMO KO mice responded to insulin like the WT mice (C). The line graphs represent the means ± SD of triplicate measurements. ns = not significant, ** p < 0.01.

