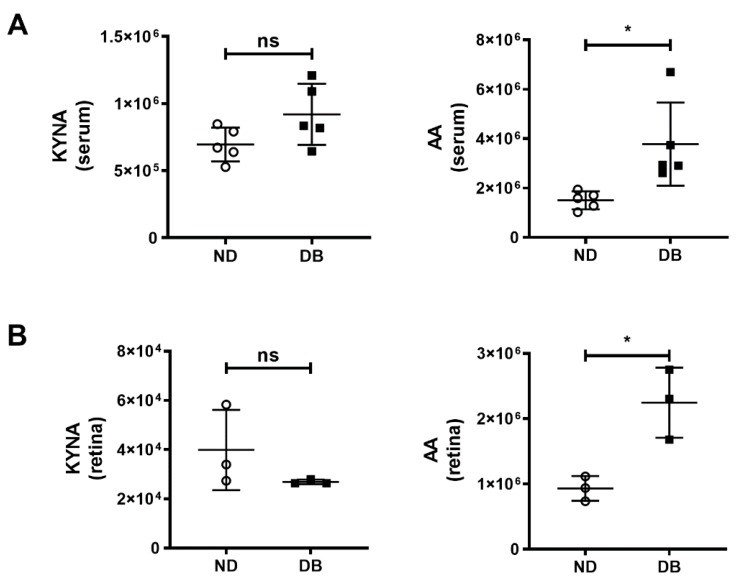
Figure 6.
The KYNA and AA were measured by LC-MS/MS (area under curve) in (A) serum (n = 5) and (B) retinas (n = 3) of non-diabetic (ND) and diabetic mice (DB). The KYNA levels in the serum and retina were not significantly different but the AA levels were higher in diabetic mice than in non-diabetic mice. The graphs represent the means ± SD of number of measurements mentioned above. ns = not significant and * p < 0.05.

