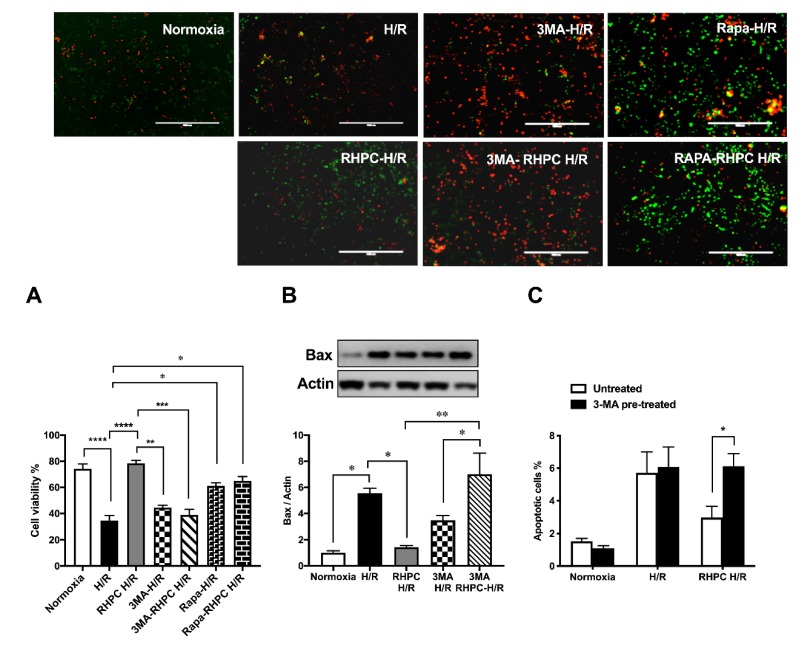
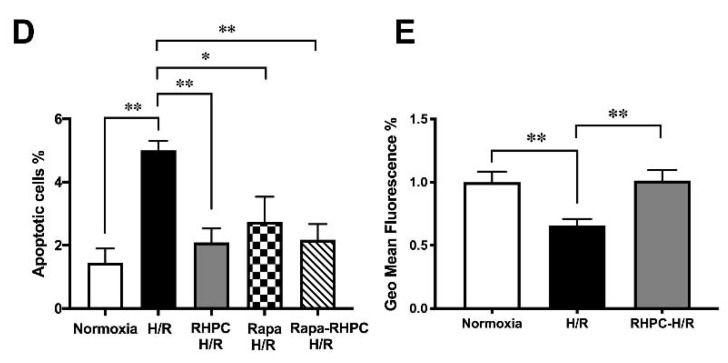
Figure 3.
Effect of autophagy modulation on cell viability. (A) H9c2 cells were stained with calcein AM (green) and ethidium homodimer-1 (red). Green: live cells, Red: dead cells; the scale bar is 1000 μm. Quantitative analysis of percentage of live/dead cells expressed as mean ± SEM, (B) Western blot analysis of pro-apoptotic Bax protein expression are expressed as mean ± SEM, fold relative to the normoxic control, (C,D) Cell apoptosis assessed by fluorescein isothiocyanate (FITC)-labeled annexin V (annexin V-FITC) and propidium iodide (PI) double staining and fluorescence-activated cell sorting (FACS). Quantitative analysis of percentage of apoptotic cells (annexin-V+/PI+) cells are represented as mean ± SEM; (E) Mitochondrial membrane potential at 1 h post-reoxygenation assessed by 1,1′,3,3,3′,3′-hexamethylindodicarbocyanine iodide (DiLC5) staining and FACS represented as the percentage geo mean fluorescence ± SEM, fold relative to the normoxia control; n = at least 3 independent experiments, * p < 0.05, ** p < 0.01, *** p < 0.001, **** p < 0.0001.


