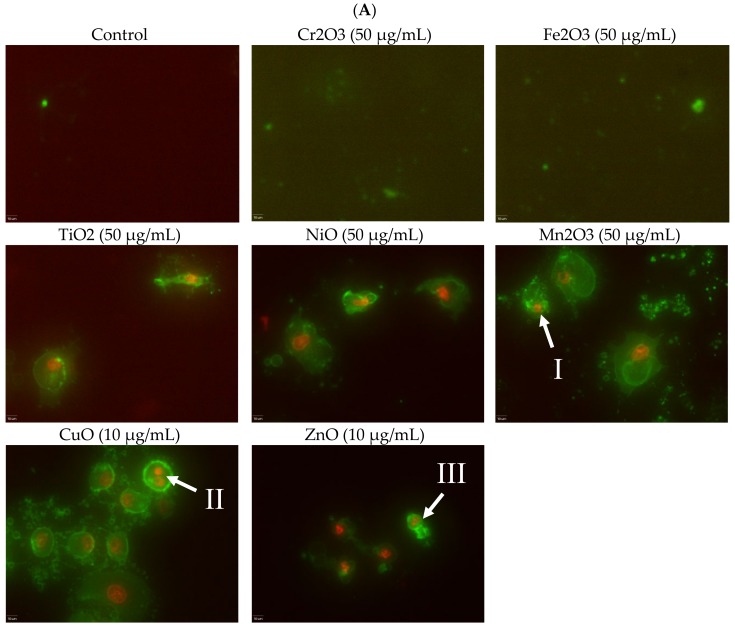
Figure 3.
(A) Fluorescence apoptotic stains with Annexin V-FITC and 7-aminoactinomycin D (7-AAD) after cells were exposed to nanoparticles at 50 or 10 µg/mL. Green color alone indicates cells undergoing early apoptosis. Red and green in combination indicate cells undergoing late apoptosis. Examples of (I) blebbing, (II) nuclear fragmentation, and (III) apoptotic bodies are marked. Scale bar is 10 μm. (B) SEM images of A549 cells after exposure to 50 μg/mL MnO. Membrane blebbing is quite noticeable in the close-up image.


