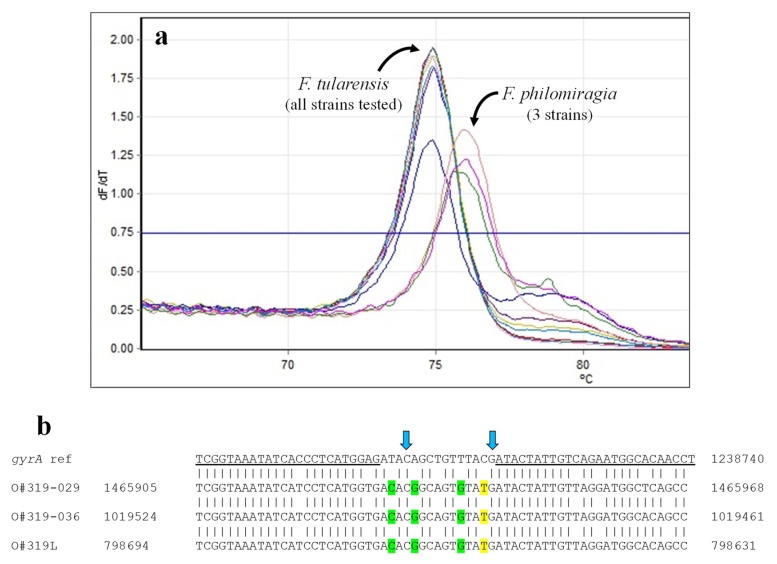
Figure 4.
HRMA—Francisella spp. gyrA. (a) Melt curves for Francisella spp. gyrA amplicons. (b) Comparison of reference gyrA sequence with published sequences from F. philomiragia strains (see Table 9). All F. tularensis strains tested are identical to the reference sequence within the stretch interrogated. Primer sequences are underlined. Arrows indicate nucleotide positions where changes are demonstrated to result in quinolone resistance [34,35]. Sequence differences predicted to result in increased or decreased Tms are highlighted in green and yellow, respectively.

