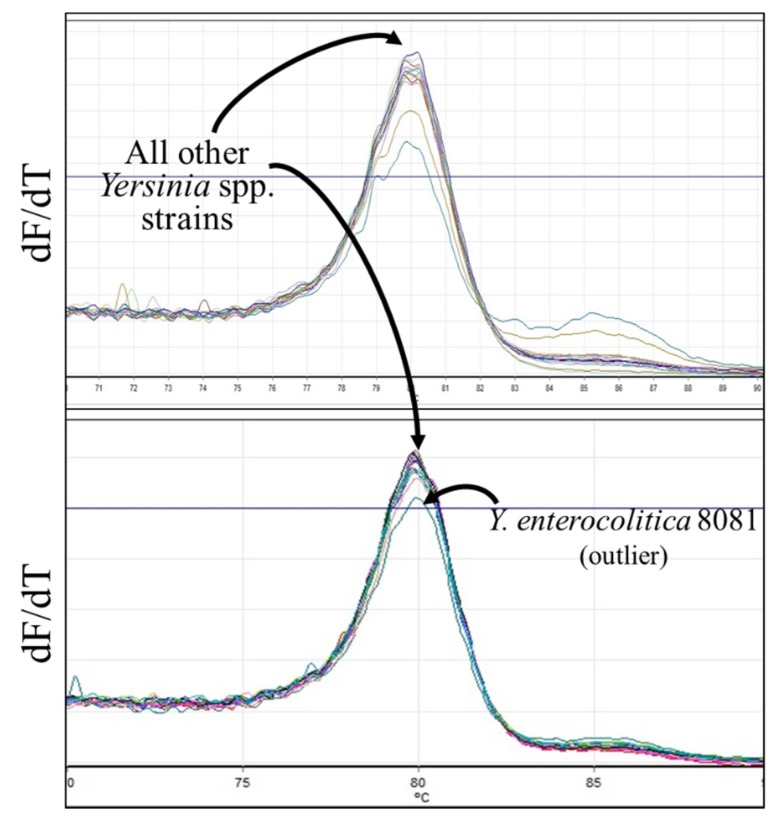
Figure 6.
Melt curves for Yersinia spp. gyrA. All samples, independent of species, had melt curve profiles with Tms centered around 80.0 °C (panels show results obtained on different days). The melt curve for the outlier Y. enterocolitica 8081 is shown on the lower curve; there is no obvious feature responsible for its clustering outside of all other Yersinia spp. strains tested.

