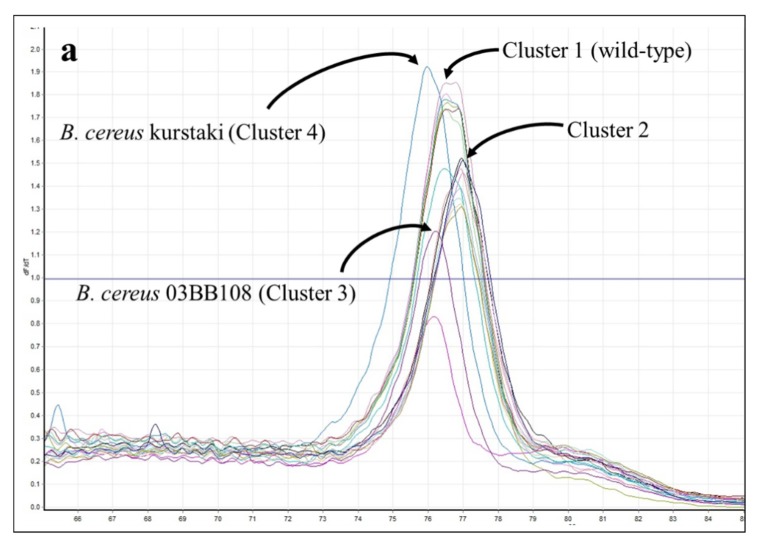
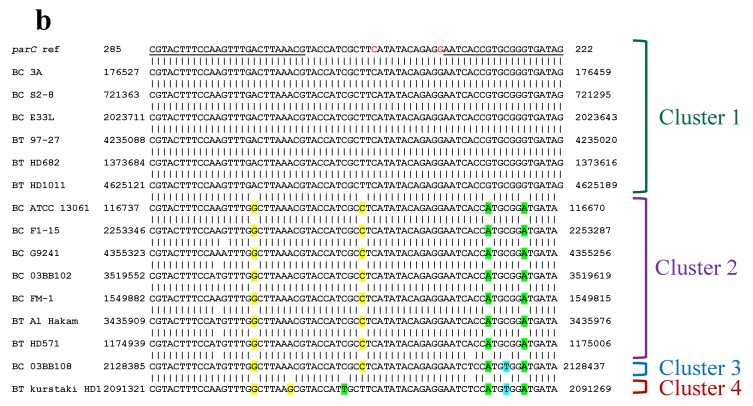
Figure 11.
HRMA—B. cereus and B. anthracis parC. (a) Melt curves for B. cereus and B. thuringiensis parC amplicons. (b) Comparison of reference B. anthracis parC sequence with published sequences for the B. cereus (BC) and B. thuringiensis (BT) strains (see Table 13 for accession numbers). Primer sequences are underlined; mutations at the locations shown in red have been documented to cause fluoroquinolone resistance in B. anthracis. Substitutions predicted to increase or decrease amplicon Tms are highlighted in yellow or green, respectively.


