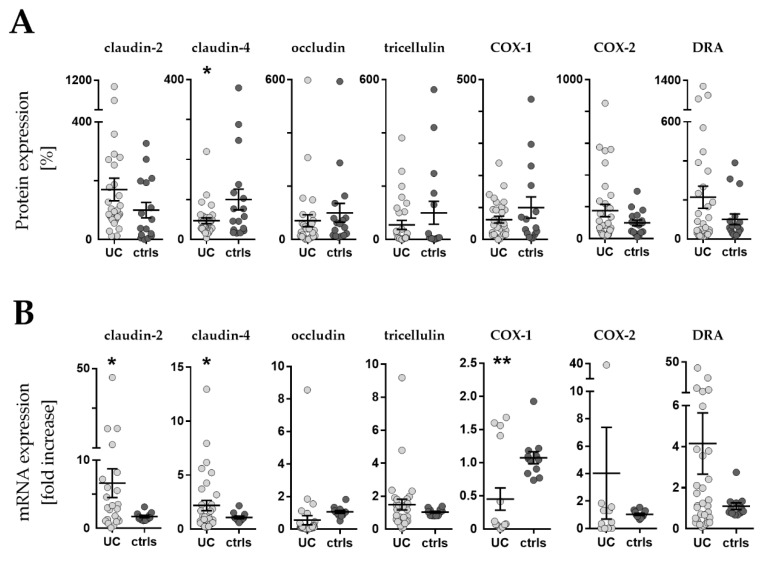
Figure 3.
Western blot and RT-qPCR. (A) Expression levels of barrier related proteins by densitometric analysis of Western blot (WB). Values are expressed as % of a mean of all controls (ctrls). Bars indicate mean ± standard error of the mean. Asterisk indicates statistically significant difference between groups (* p < 0.05). (B) mRNA levels by RT-qPCR. Values are expressed relative to a mean of all controls. Three controls (18%, 3/17) presented a different baseline of housekeeping genes, while two controls (12%, 2/17) presented outliers, which were removed, leaving the final number of controls for mRNA analysis at 12 (70% 12/17). One outlier (3%, 1/33) was removed from the UC group. n = number of UC observations: COX-1 (n = 16), COX-2 (n = 11), claudin-2 (n = 23), claudin-4 (n = 33), occludin (n = 31), tricellulin (n = 29), and DRA (n = 33). Bars indicate mean ± standard error of the mean. Asterisks indicate statistically significant difference between two groups (* p < 0.05, ** p < 0.01).

