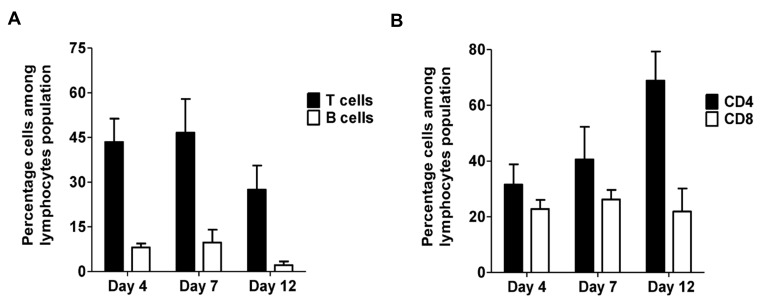
Figure 1.
T cells and B cells are present in venous thrombus. (A) Quantitative analysis of the percentage of B cells (B220) and T cells (CD3) among the lymphocyte populations in the thrombus lysate. All values represent the mean ± SEM. (n = 2–4 per time point). (B) Quantitative analysis of percentage of CD4+ and CD8+ cells among the T lymphocyte population in the thrombus lysate. All values represent the mean ± SEM. (n = 2–4 per time point).

