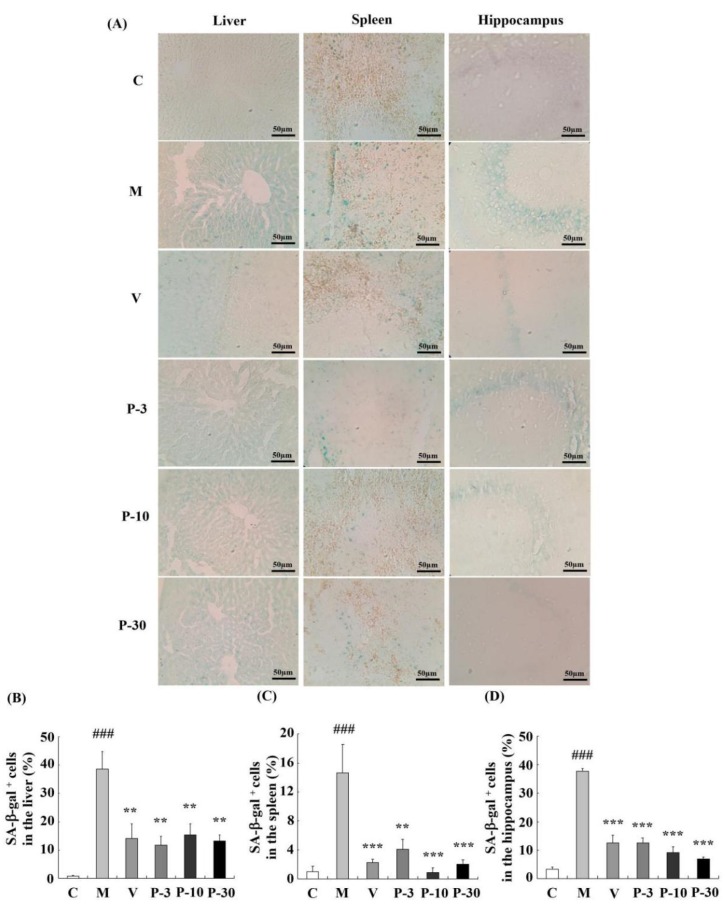
Figure 7.
PAE effects on the activity of SA-β-gal in the liver, spleen, and brain. (A) The representative image of SA-β-gal staining in each group was captured (magnification 400×). (B–D) Quantification of the percentage of SA-β-gal-positive cell numbers in the liver, spleen, and hippocampus. Blue staining stands for SA-β-gal-positive cells. The data are expressed as mean ± SEM, n = 6. ### p < 0.001 indicate significant difference compared with the control group; ** p < 0.01, and *** p < 0.001 indicate significant difference compared with the d-gal-treated group. C, control group, C received saline; M, d-gal model group, M received 150 mg/kg d-gal; V, 100 mg/kg VE group, it received 100 mg/kg VE + 150 mg/kg d-gal; P-3, 3 mg/kg PAE group, it received 3 mg/kg PAE + 150 mg/kg d-gal; P-10, 10 mg/kg PAE group, it received 10 mg/kg PAE + 150 mg/kg d-gal; P-30, 30 mg/kg PAE group, it received 30 mg/kg PAE + 150 mg/kg d-gal.

