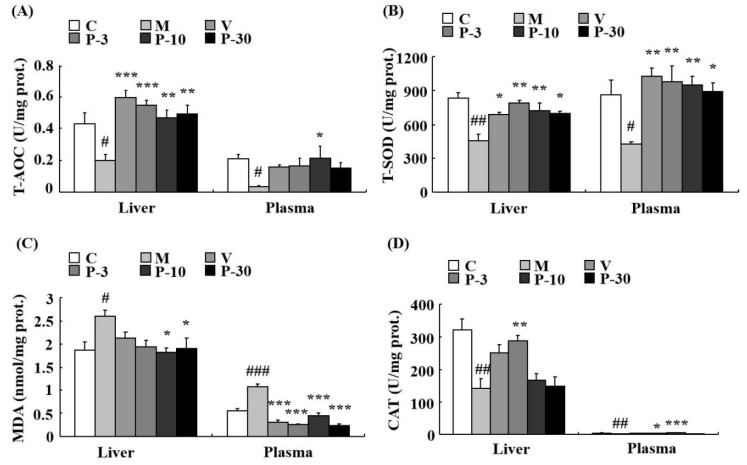
Figure 8.
PAE decreased the oxidative stress in the liver and plasma. (A) Changes in total antioxidant capacity (T-AOC), (B) total superoxide dismutase (T-SOD) activity, (C) malondialdehyde (MDA) level, and (D) catalase (CAT) activity in the liver and plasma. Each value represents the mean ± SEM of 6 mice. # p < 0.05, ## p < 0.01 and ### p < 0.001 indicate significant difference compared with the control group; * p < 0.05, ** p < 0.01, and *** p < 0.001 indicate significant difference compared with the d-gal-treated group. C, control group, C received saline; M, d-gal model group, M received 150 mg/kg d-gal; V, 100 mg/kg VE group, it received 100 mg/kg VE + 150 mg/kg d-gal; P-3, 3 mg/kg PAE group, it received 3 mg/kg PAE + 150 mg/kg d-gal; P-10, 10 mg/kg PAE group, it received 10 mg/kg PAE + 150 mg/kg d-gal; P-30, 30 mg/kg PAE group, it received 30 mg/kg PAE + 150 mg/kg d-gal.

