Figure 3.
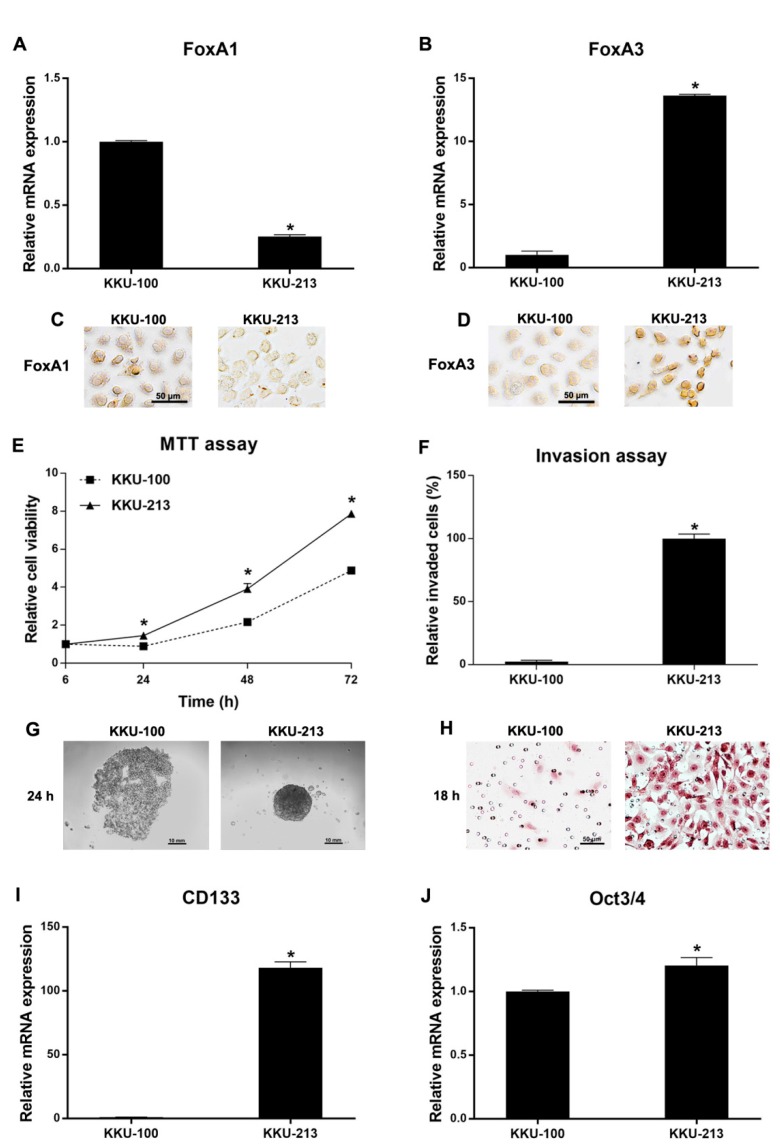
Cellular function analysis of KKU-100 and KKU-213: (A,B) mRNA expression (mean ± SD) of FoxA1 and FoxA3 measured by real-time PCR (n = 2 for each condition); (C,D) immunocytochemical detection of FoxA1 and FoxA3 proteins; (E) cell proliferation activity (mean ± SD) measured by 3-(4,5-Dimethylthiazol-2-yl)-2,5-Diphenyltetrazolium Bromide (MTT) assay (n = 5 per each time point per condition); (F) graphical representation of invaded cells (mean ± SD) in cell invasion assay (n = 5 per condition); (G) spheroid formation in hanging drop cultures; (H) hematoxylin-stained invaded cells under a light microscope in the cell invasion assay; and (I,J) mRNA levels (mean ± SD) of CD133 (I) and Oct3/4 (J) detected by real-time PCR (n = 2 per condition). * p < 0.05 by Student’s t test. All results were confirmed by three independent experiments.

