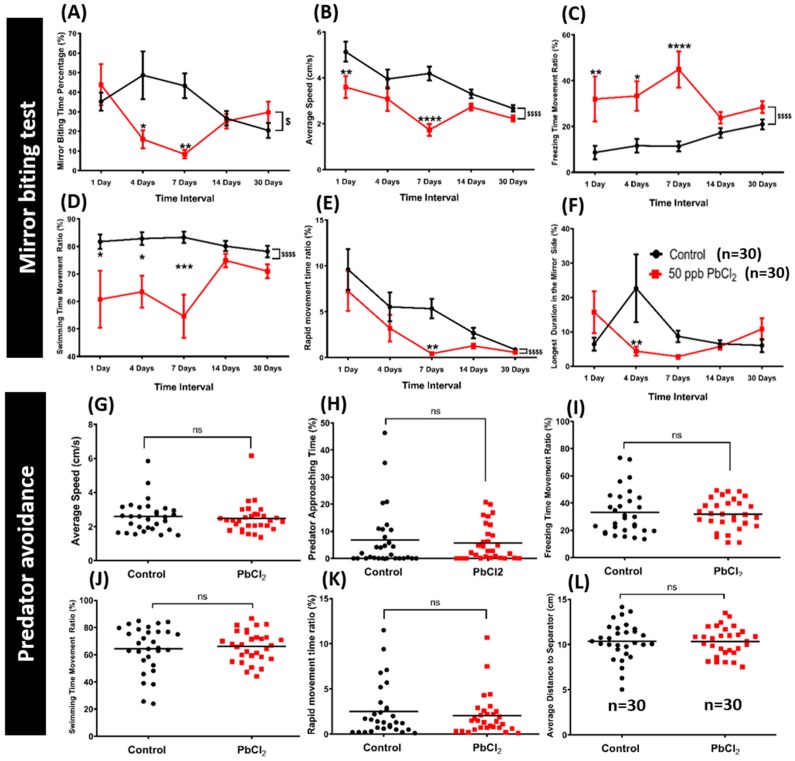
Figure 4.
Evaluation of aggressiveness and fear by mirror-biting and predator avoidance tests between the control and 50 ppb PbCl2-treated fish. After PbCl2 exposure (red line), the mirror biting behavior was chronologically monitored and the data were presented as (A) mirror biting time percentage, (B) average speed, (C) freezing time movement ratio, (D) swimming time movement ratio, (E) rapid movement time ratio, and (F) longest duration in the mirror side. Data are expressed as mean ±SEM values and analyzed by two-way ANOVA with Sidak’s multiple comparisons test (n 1 & 7 days = 10, n 14 days = 40, n 30 days = 30; */$ p ≤ 0.05, ** p ≤ 0.01, *** p ≤ 0.001 and ****/$$$$ p ≤ 0.0001). After PbCl2 exposure for 30 days, the predator avoidance behavior was monitored and data were presented as (G) average speed, (H) predator approaching time, (I) freezing time movement ratio, (J) swimming time movement ratio, (K) rapid movement time ratio, and (L) average distance to separator. Data are expressed as mean and analyzed by the Mann–Whitney test (n = 30).

