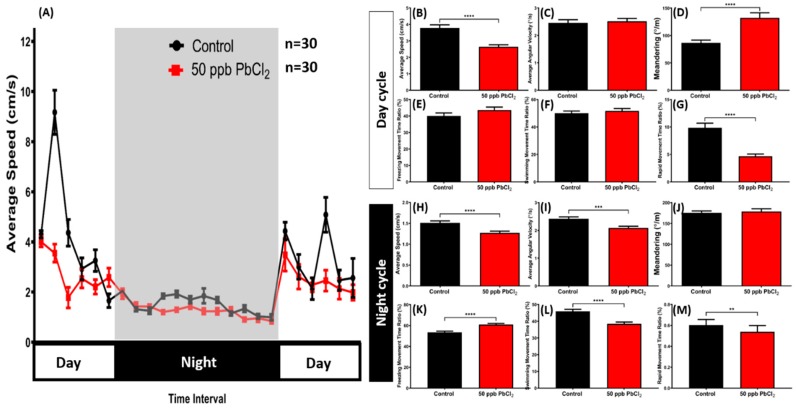
Figure 6.
Evaluation of the circadian rhythm locomotor activity for control and chronic PbCl2-treated fish (50 ppb, red). (A) Circadian locomotor activity patterns of average speed; (B) average speed; (C) average angular velocity; (D) meandering; (E) freezing movement time ratio; (F) swimming movement time ratio; and (G) rapid movement ratio during the light cycle; (H) average speed; (I) average angular velocity; (J) meandering; (K) freezing movement time ratio; (L) swimming movement time ratio; and (M) rapid movement ratio during the dark cycle. The data are expressed as mean ± SEM and analyzed by the Mann–Whitney Test (n control fish = 18; n PbCl2-treated fish = 18; ** p < 0.01, *** p < 0.001, **** p < 0.0001).

