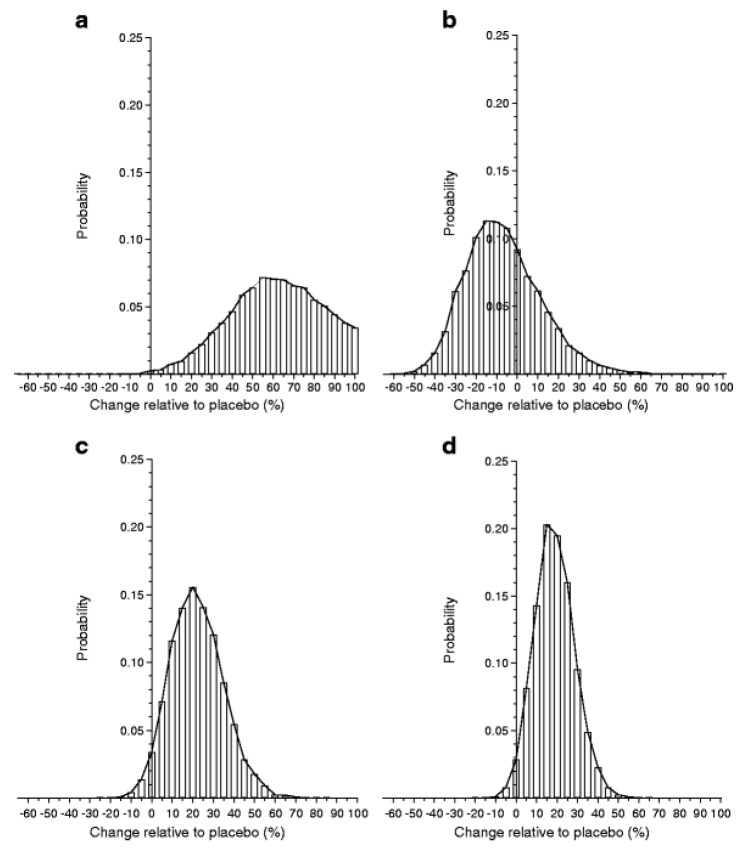
Figure 1.
From Ref. [94] PPBE from the two-dose glutamic acid decarboxylase (GAD) vaccine. Histograms of the results from Bayes analysis of the effect of two-dose GAD treatment relative to placebo. Histogram bars are centered at 5% units representing a 5% increase (if positive) or decrease (if negative) in C-peptide change in treated individuals compared with placebo. The width of each bar represents a range of biological effects (change) of ±2.5% of the bar center. The height of each bar corresponds to the probability of that range of effect. The sum of the areas of the bars above zero gives the PPBE: (a) Ludvigsson (2008) [88], 99.8%; (b) Wherrett (2011) [91], 32.1%; (c) Ludvigsson (2012) [92], 96.6%; (d) meta-analysis, 98.0%.

