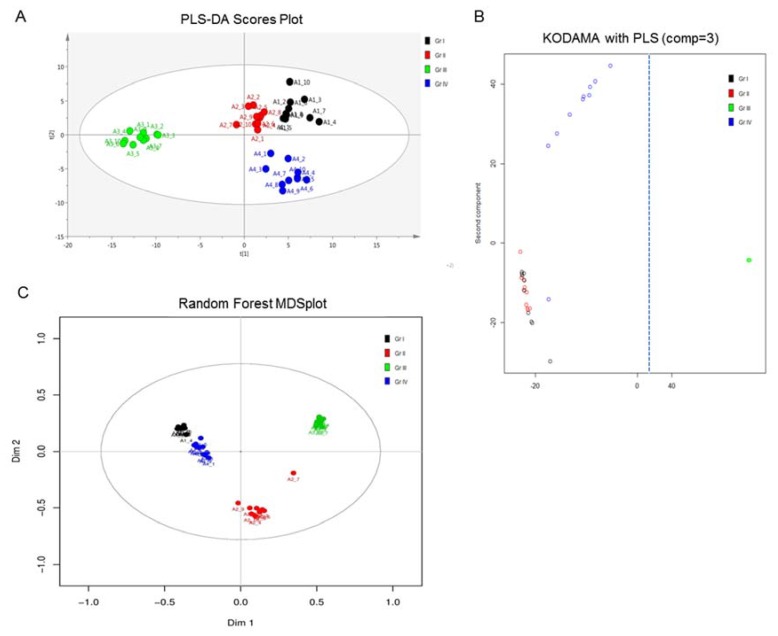
Figure 5.
Comparison of the PLS-DA modeling of MS analysis, with KODAMA and Random Forest methods for the four UBC cell lines herein examined. All methods presented the greatest separation for the grade III (T24) group, highlighting T24 as the most suitable cell line to study the metabolic signature of highly malignant and strongly metastatic UBC disease. Black: grade I (RT4), Red: grade II (RT112), Green: grade III (T24), and Blue: grade IV (TCCSUP). (A) Principal Component (PC) scores plot from PLS-DA model. (B) PC scores plot from the KODAMA-PLS model. Figure is cut on the x-axis (dashed line), as grade III (T24) is far removed from the initial conditions. (C) Multidimensional Scaling (MDS) plot from the Random Forest model. Gr: (malignancy) grade.

