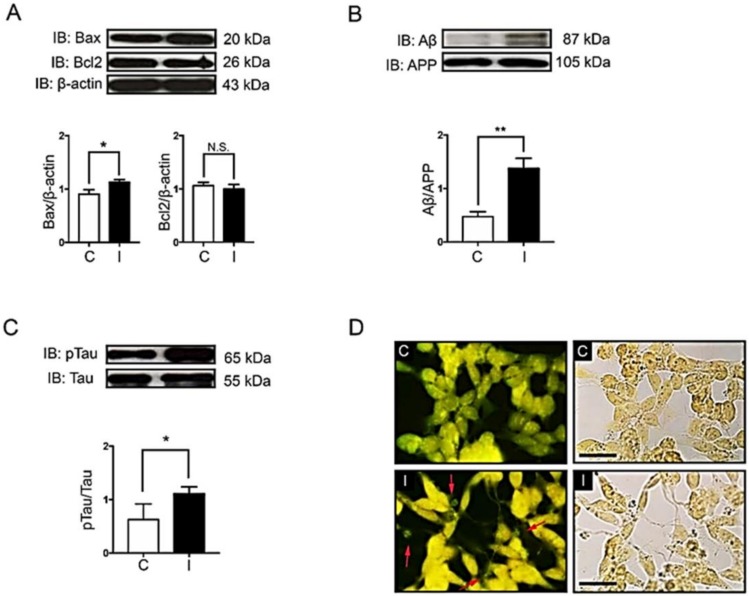
Figure 3.
Effects of hyperinsulinemic conditions on apoptotic signals, Aβ and tau proteins. The normal cells (C) and insulin-resistant cells (I) were used to determine protein expression, including apoptotic signal proteins Bax and Bcl-2 (A), Aβ (B) and pTau (Ser396) (C). The Western blotting bands and bar graphs represent densitometric values of each lane after normalizing with total protein actin, amyloid precursor protein (APP), and tau protein, respectively. Values are mean ± SEM; * p < 0.05, ** p < 0.01 compared with normal cells (C). Thioflavin-S staining of neuritic plaques was done in SH-SY5Y cells (D). C and I represent the control and insulin-resistant groups, respectively. The stained cells were visualized by fluorescent microscope at 40X magnification. Red arrows indicate Thioflavin-S stained neuritic plaques. Scale bar, 25 µm. All experiments shown were from n = 3.

