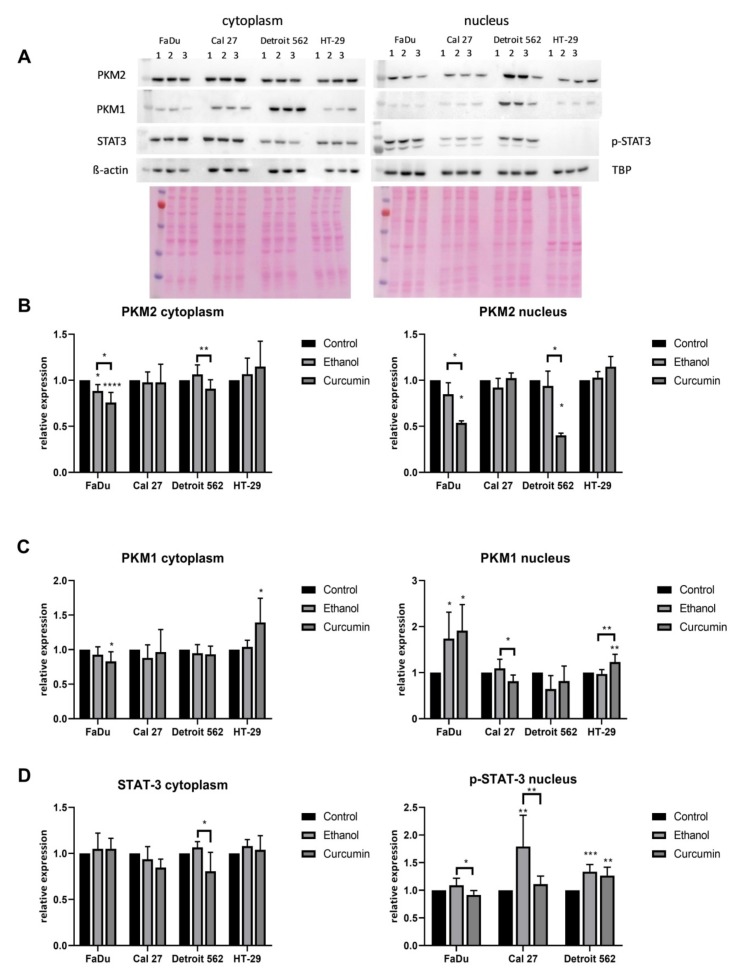
Figure 8.
Expression of PKM1, PKM2 and STAT3 in cancer cell lines. Representative Western blots of cytoplasmic and nuclear PKM1, PKM2 and STAT3 content under different: (A) Western Blot. Lines: #1: control; #2: ethanol; #3: curcumin. Relative expression is calculated as compared to the untreated cells. (B)-cytoplasmic and nuclear PKM2; (C)-cytoplasmic and nuclear PKM1; (D)-cytoplasmic non-phosphorylated and nuclear phosphorylated STAT3 (Y705). One-way ANOVA with Tukey post hoc test was used to test the differences in relative expression of selected proteins based on minimally five independent experiments. Values are shown as mean ± SD. n = 5–7. * p <0.05; ** p < 0.01; *** p <0.001; **** p <0.0001.

