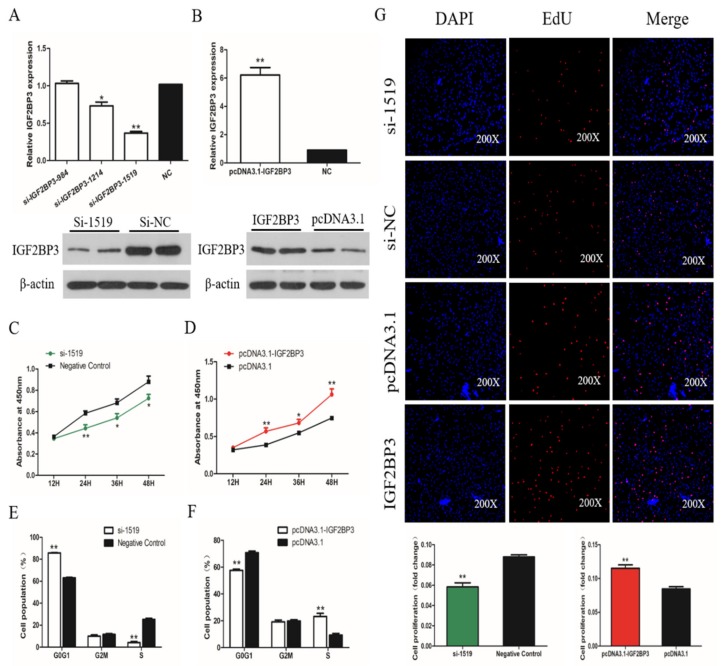
Figure 5.
The effect of IGF2BP3 on the proliferation of SMSCs. (A,B) Screening IGF2BP3 interfering fragments and verifying overexpression efficiency by qPCR and Western Blot. The data are presented as mean ± SEM (n. = 6). The Student’s t-test was used to compare expression levels among different groups. * p < 0.05; ** p < 0.01 vs. NC. (C,D) Cell growth curves, as measured from CCK-8 assays, following transfection with si-IGF2BP3, pcDNA3.1-IGF2BP3, or negative control in SMSCs. (E,F) Cell cycle analysis of SMSCs 48 h after the overexpression and inhibition of IGF2BP3. (G) The results of the EdU assay for SMSCs transfected with si-IGF2BP3, pcDNA3.1-IGF2BP3, or negative control, where EdU (red) fluorescence is used as an indicator of proliferation and nuclei are indicated by DAPI (blue) fluorescence. Micrographs were taken using 200× magnification, and the proliferation rates of SMSCs cells were measured with IGF2BP3 overexpression and inhibition. The data are expressed as mean ± SEM (n. = 6). * p < 0.05; ** p < 0.01 vs. NC.

