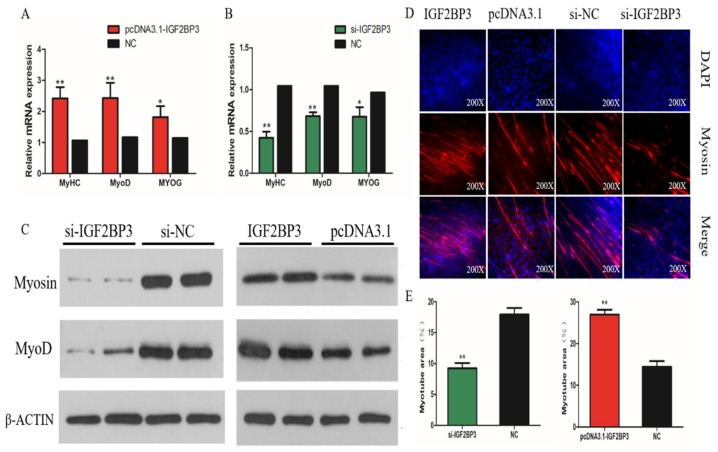
Figure 6.
Effect of IGF2BP3 on differentiation of SMSCs. (A,B) The relative expressions of MyoD, MyHC, and MyoG mRNA in SMSCs allowed to differentiate for 48h. (C) The Western Blot results for protein levels of myogenic marker genes after inhibition and overexpression of IGF2BP3. (D) The Representative images of immunofluorescent staining of differentiated SMSCs (200x). Myosin: red, a molecular marker of myogenesis; DAPI: blue, cell nuclei; Merge: the fusion of SMSCs into primary myotubes. (E) The Myotube area (%) after the transfection of si-IGF2BP3, pcDNA3.1-IGF2BP3 or negative control. The data are expressed as mean ± SEM (n = 6). * p < 0.05; ** p < 0.01 vs. NC.

