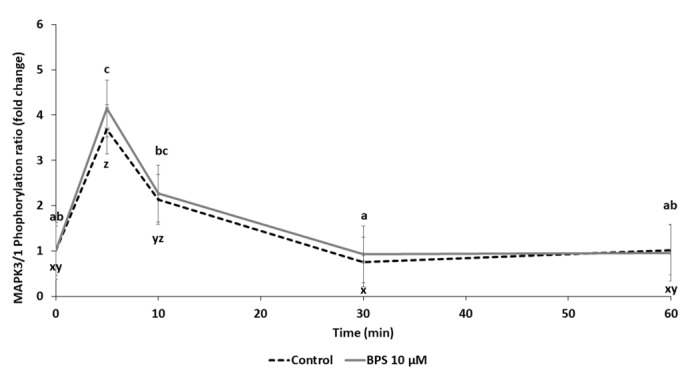
Figure 7.

Western blot analysis of MAPK3/1 signalling pathway activation in human granulosa cell (HGC) after Bisphenol S (BPS) exposure. HGC underwent a time response (0 to 60 min culture) in the presence or absence of BPS 10 µM. Proteins were then extracted and separated using electrophoresis in 4–12% (w/v) sodium dodecyl sulphate polyacrylamide gels. After electrotransfer to nitrocellulose membranes, the proteins were probed with phospho-MAPK3/1 and total MAPK3/1 antibodies. Bands on the blots were quantified, and the data are expressed in arbitrary units as the ratio of phospho- to total MAPK3/1 as the mean ± standard error of the mean (SEM) of six independent experiments. Different letters indicate significant differences (p ≤ 0.05). abc letters correspond to differences in MAPK3/1 phosphorylation between 10 µM BPS timepoints, and xyz letters correspond to differences in MAPK3/1 phosphorylation between control timepoints.
