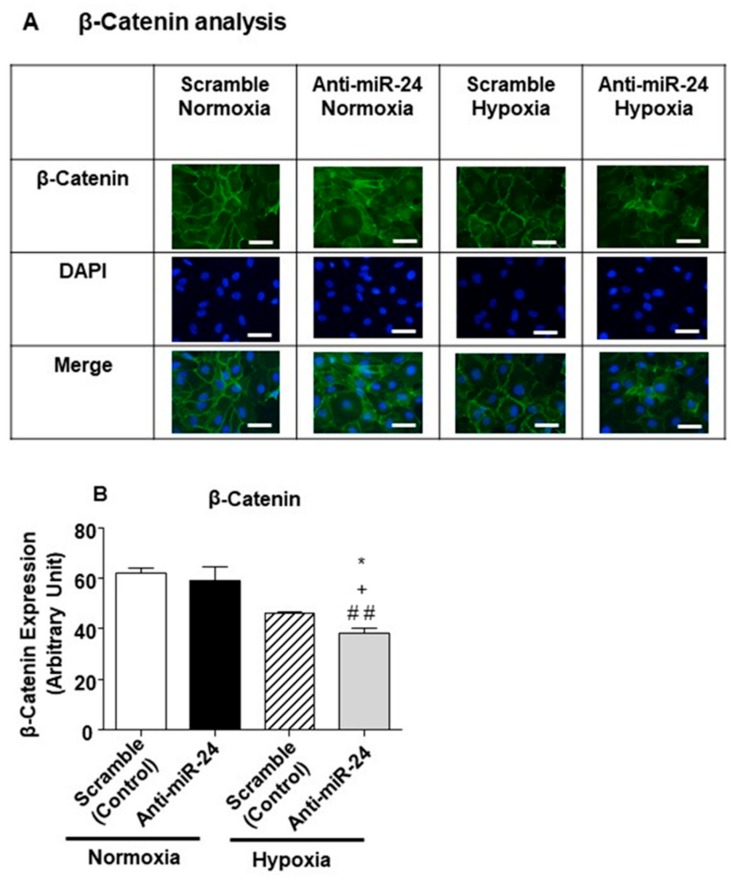
Figure 8.
β-catenin modulation in in vitro model of hypoxia. (A) The panel shows representative pictures of β-catenin staining in HUVECs treated with miR-24-3p inhibitor and exposed to hypoxia (1% O2) or kept under standard culture conditions for 48 h. Scale bars corresponds to 50 um (B) Bar graph shows the quantification of the staining, where the black bar represents HUVECs treated with miR-24-3p inhibitor, and the white bar represents HUVECs treated with scramble (transfection control). Adhesion assay was performed in quintuplicate and repeated two times; β-catenin staining was performed in triplicate and repeated three times. Values are means ± SEM. * p < 0,05 vs. scramble hypoxia, + p < 0.05 vs. anti-miR-24-3p in standard culture conditions; ## p < 0.01 vs. scramble in standard culture conditions.

