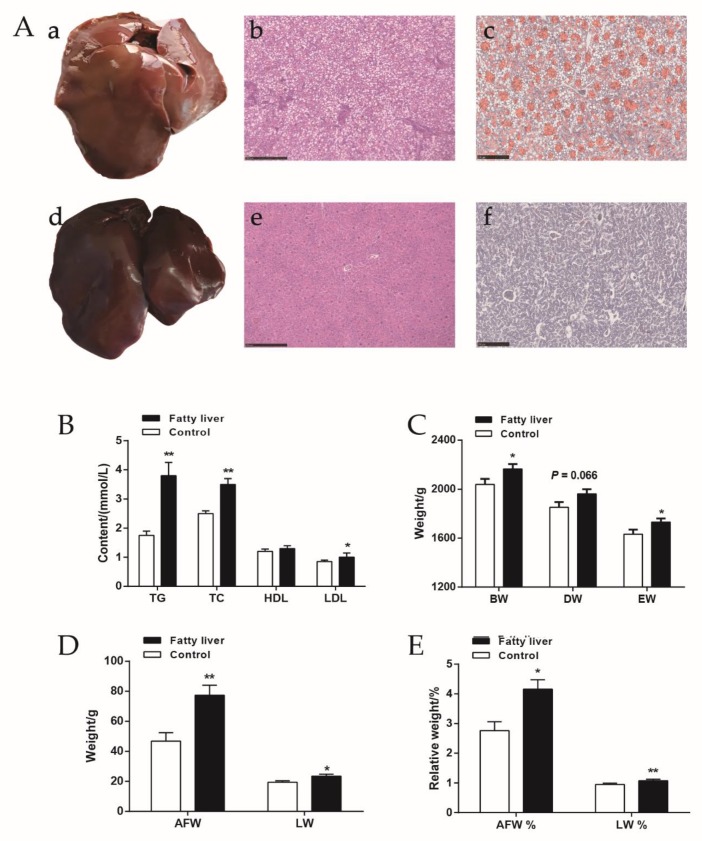
Figure 1.
Liver histopathology and phenotypic identification. (A) The plots of liver histopathology. The plots of a–c represent the phenotype, HE staining, and Oil red O staining of fatty liver, respectively, while the plots of d–f represent the same items of normal liver (250 µm). (B) Contents of lipids in serum. Includes high-density lipoprotein (HDL), low-density lipoprotein (LDL), total cholesterol (TC) and triglyceride (TG), n > 10 per group. (C) Bodyweight (BW), dressed weight (DW) and eviscerated weight (EW) of chickens in two groups, n > 20 per group. (D) Abdominal fat weight (AFW) and liver weight (LW) of chickens in two groups, n > 20 per group. E Relative weight of abdominal fat (AFW %) and liver (LW %) of chickens in two groups, n > 20 per group. * represents p < 0.05, ** represents p < 0.01.

