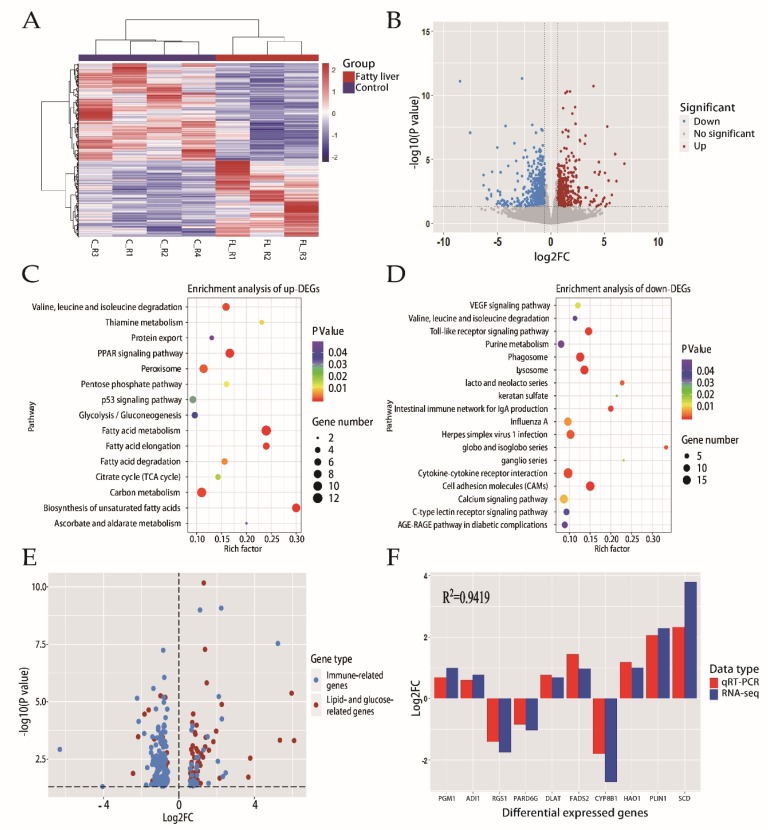
Figure 2.
Transcriptomic changes and enrichment analysis in normal liver and fatty liver. (A) Heatmap of differentially expressed genes (DEGs) via hierarchical cluster analysis. Different rows correspond to different genes, red and blue strips represent up- and downregulation, respectively. (B) Volcano plot revealing DEGs with various p-values and fold changes (FC). Vertical line, FC = 1.5; horizontal line, p-value = 0.05. Red points, upregulated genes; blue points, downregulated genes. (C) Pathways of enrichment analysis with upregulated DEGs. Rich_factor, the ratio of imputed genes to background genes. (D) Pathways of enrichment analysis with downregulated DEGs. (E) The expression profile of lipid- and glucose-related DEGs and immune-related DEGs. (F) Verification results of qPCR for 10 randomly selected DEGs.

